

Welcome to Kuugaaluk
Summer, 2026 was the second season of collecting data at Kuugaaluk across multiple study topics which reflect the main concerns raised by Iqalungmiut and Panniqtuumiut in public engagement sessions.
This work is a continuation of the work done in 2025 and supports a good understanding of current conditions, potential impacts if a water power project were built, and how we can minimize those impacts. All research was approved by relevant regulatory bodies. The consultants who completed this work were selected through a Request for Proposals process, with priority given to Inuit firms, firms with high Inuit employment, and local firms.
Explore each of the study topics further on the interactive maps below – there’s lots to learn!
To view the maps from 2025 field studies, click here.
Tip: These maps are best viewed on a tablet or laptop-sized screen.
Aquatics
The Aquatics Team completed studies over several visits between late June and mid September, totaling 35 working field days. Dillon Consulting Ltd. and Inuit assistants and wildlife monitors continued the aquatics program from last year, to learn more about the freshwater environment at Kuugaaluk.
Surveys were done in the lake, the downstream river, in the upstream river, and smaller streams that flow into the river.
The studies looked at the waters throughout Kuugaaluk area to better understand how much water there is, water quality, fish habitat, and how these things change through the seasons. This information will help the project team understand the aquatic environment at Kuugaaluk and how the project could affect water, fish and fish habitat.
Thank you to our crew and local Inuit knowledge holders who made this work possible.
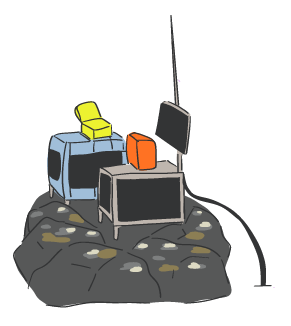
- Click on the people and equipment to learn what the team did during the field season.
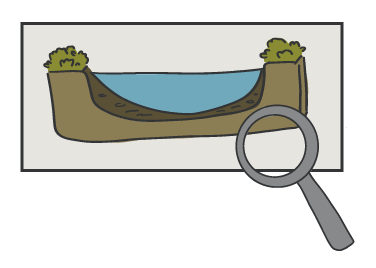
- Click on the magnifying glasses and other objects to see what was found.
- Click outside the text boxes to hide them again.
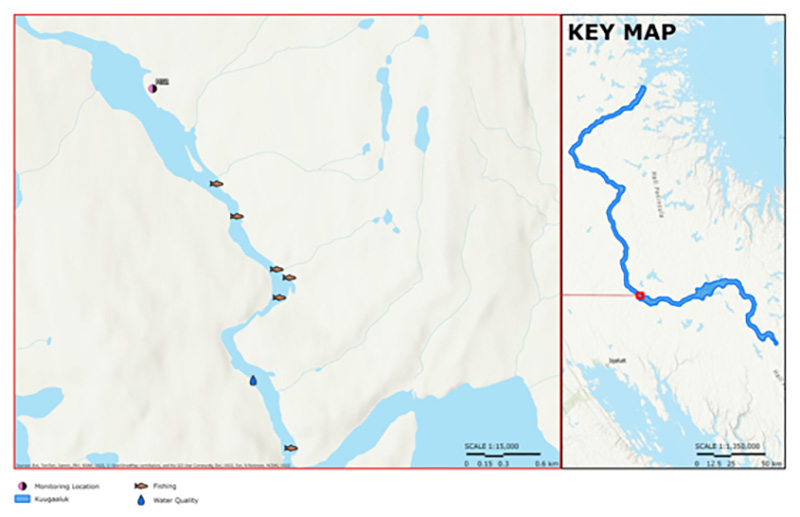
Study Area 1: The Lake at Kuugaaluk
The aquatics team studied the lake at Kuugaaluk and twelve small streams that flow into the lake. They learned about water quality and habitats.
The lake at Kuugaaluk (the proposed reservoir) is a flow-through lake. This means water is always moving through it. Along its main flow path, it's deeper than 10m, but in some places, it's up to 18m deep.

Study Area 2: The Downstream River
The aquatics team studied the river downstream of Kuugaaluk in several places, and learned about the river's flow, water levels, and water quality, as they are today.
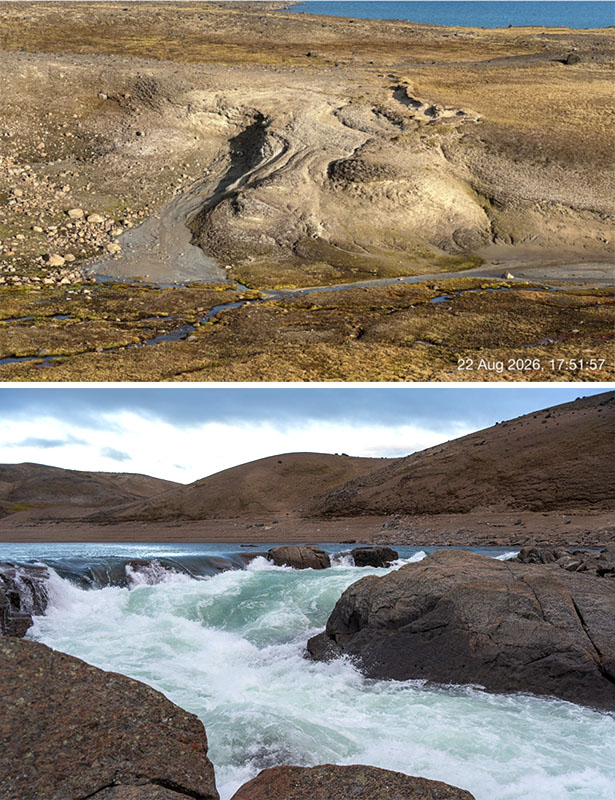
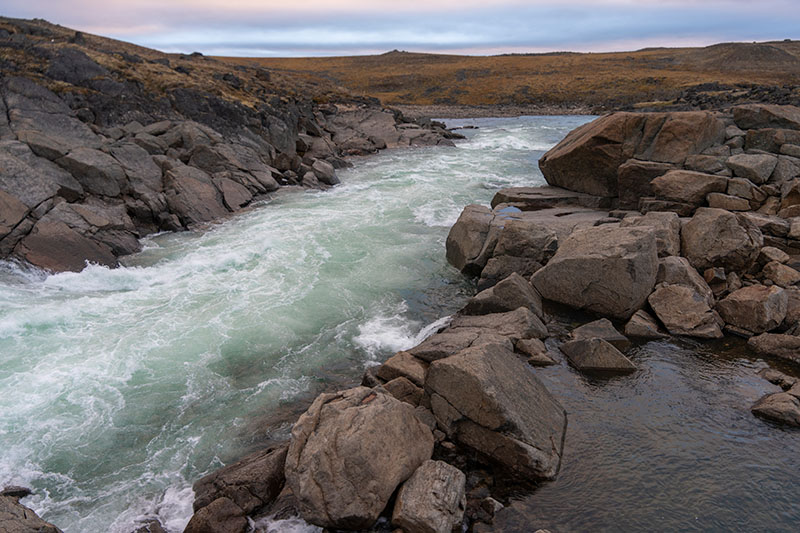
The river flows fast and the water is clear. There are some places with boulders and waterfalls, and other places that are wide and smooth.

Water Sampling - Learning about Water Quality
The aquatics team took samples of water from the lakeshore, and from the middle of the lake (including the surface, middle and near the bottom).
They sent these samples to laboratories to test for nutrients, metals, total organic carbon (this tells us about how much plant and animal life is in the water), and methylmercury levels.
Together with information from the water data loggers, this helps us understand water quality today, and predict how the underwater environment could change if land is flooded for the proposed reservoir.
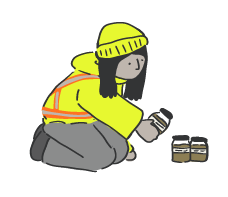
Sediment Sampling - Learning about Sediment Quality
The aquatics team took samples of dirt from the ground at the lakeshore, and the floor of the lake. They sent the samples to a laboratory to test for nutrients, metals, total organic carbon (this tells us about how much plant and animal life is in the soil), and methylmercury levels.
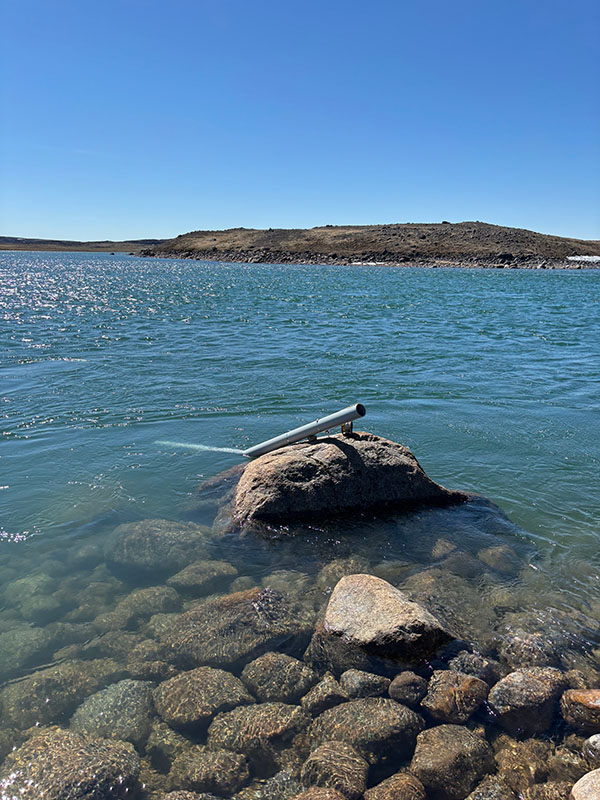
Water Level Loggers - Measuring the Amount of Water
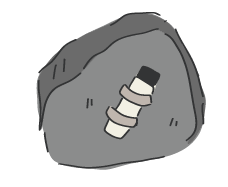
The team installed water level loggers in several places along the lakeshore (in May 2026) and the downstream river (later spring). These tools measured and recorded the water level before, during and after the spring melt, as it rises and falls.
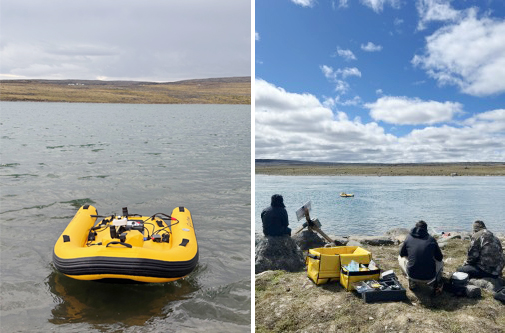
The SurfBee - Measuring the Amount of Water
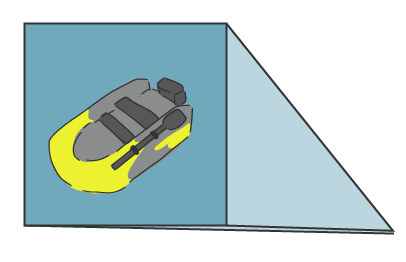
From the shore, the aquatics team sent a small remote-controlled boat (called a SurfBee) into the downstream river. The little boat has tools attached that measure how water moves through the river.
It travelled across wide shallow sections of the river, measuring:
- How deep the water was, and
- How fast the water was flowing
The team uses those numbers to figure out how much water moves through the river over time.
Water Data Loggers - Learning about Water Quality
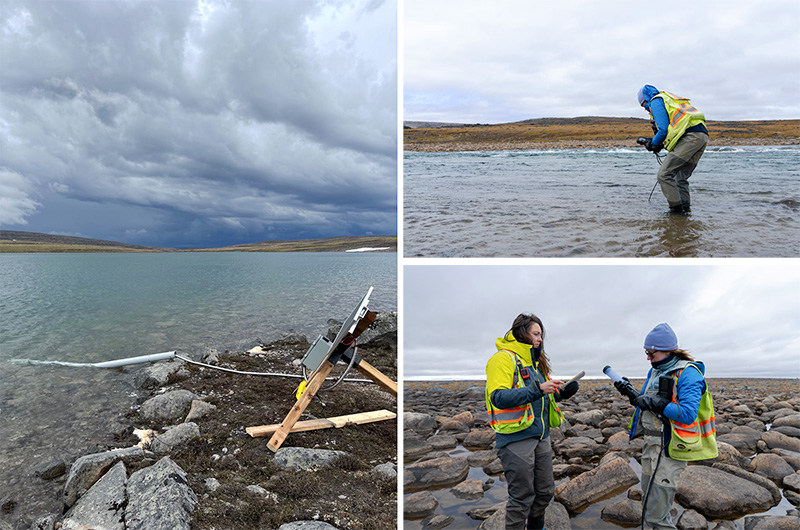
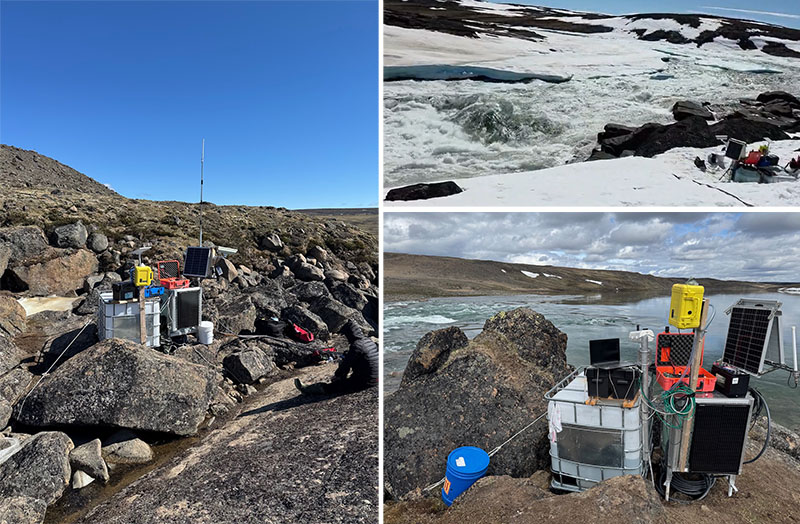
The aquatics team put water quality loggers in the river, in smaller streams (tributaries) that flow into the river, and in the proposed reservoir area.
These tools measure the water's temperature, depth, how clear it was, and mineral and oxygen levels over time. Some of the places where the crew left loggers have satellite connections. This means information constantly gets sent back to the team's office as it's collected.
Together with the water sample results, this helps us understand water quality today, and predict how the underwater environment could change if land is flooded for the proposed reservoir.
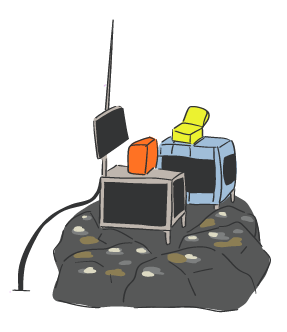
Underwater Sensors - Learning about Water Quality & Measuring the Amount of Water
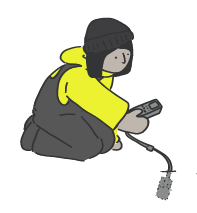
The team dropped underwater sensors on long cords into the lake at different depths to measure water depth, temperature and water quality over time.
Using Underwater Sensors, Water Data Loggers and Water Sampling, these tools help us understand how lake water changes through the seasons.
Together with LiDAR Surveys, Underwater Sensors, and the SurfBee, these tools also help us figure out how much water the proposed reservoir could hold. This is important for project planning, engineering, and future environmental studies.
Snow Surveys - Measuring the Amount of Water
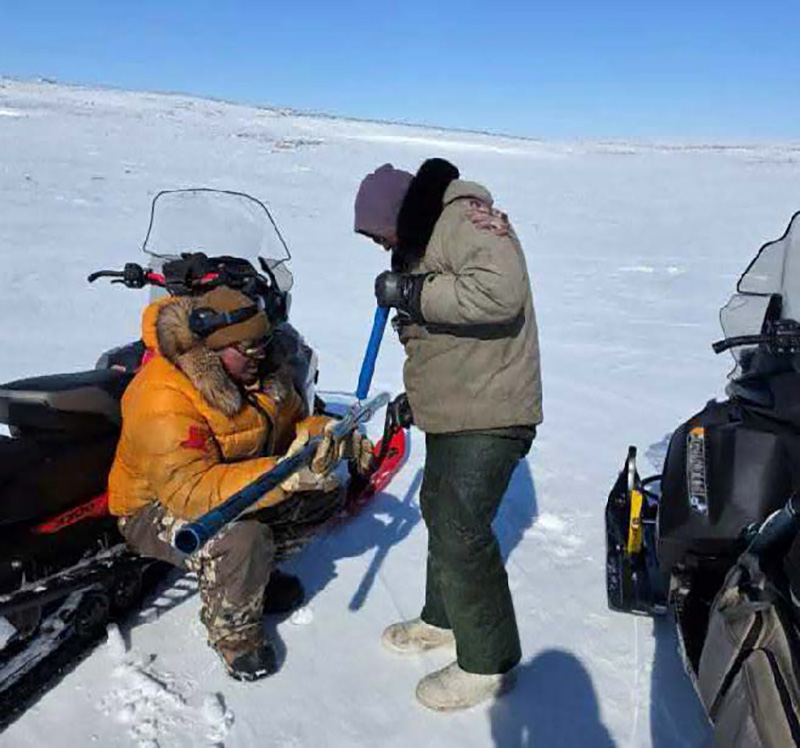
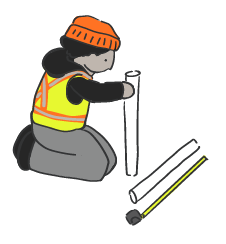
In March and April 2026, before the field camp was set up, team members measured how deep and how heavy the snow was in two places: one near the downstream river, and another near the proposed reservoir.
At each spot, they pushed a hollow tube into the snow, all the way to the ground, to get snow samples. This lets us see how much snow had piled up in the area, and helps with predicting how much water goes down the river during the spring melt (freshet).
Ice Thickness - Measuring the Amount of Water
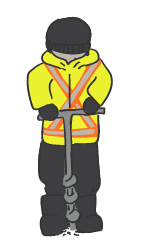
In March and April 2026, before the field camp was set up, team members measured how thick the ice was in two places: one near the downstream river, and another near the proposed reservoir.
The team drilled through the ice at different spots with an auger, down to the liquid water, to measure the ice.
Watching Spring Snow Melt - Measuring the Amount of Water
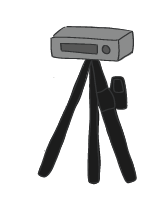
The team put a camera facing the river to document the spring melt (freshet). The camera was set up to take photos on a schedule, so we could see the changing water level over time.
Fish Sampling
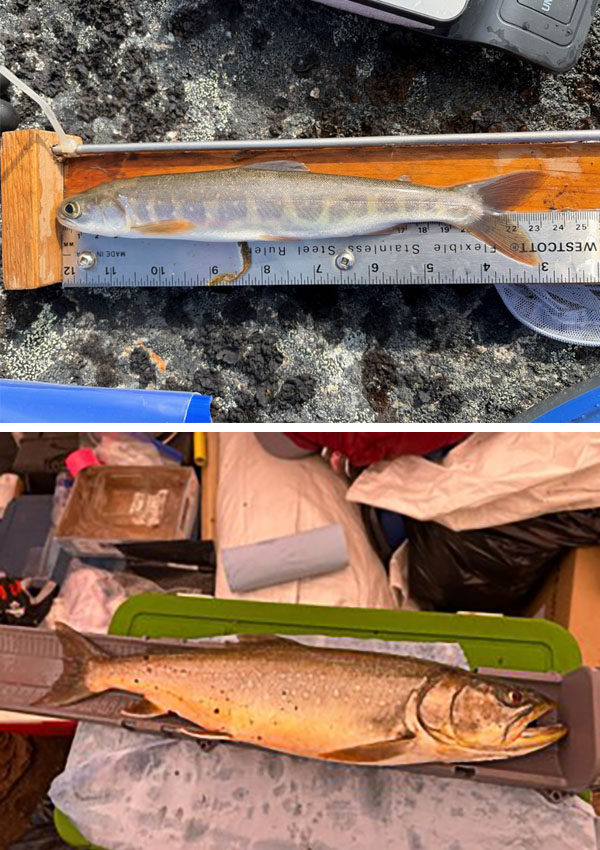
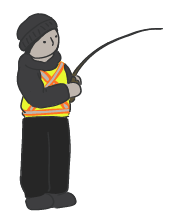
Local field crew members caught 63 fish at Kuugaaluk using fishing rods and lures. They wrote down the type of fish, the length, weight, and life stage for each fish.
Some fish were immediately released. Other fish were respectfully killed by local crew, and samples were sent to the lab down south.
The samples tell us the fish's age, and how quickly it grew. They also let us learn about mercury levels, and other things that explain what the fish eat and where they live.
Sampling Tiny Water Bugs & Plants
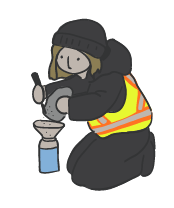
Crews took samples of the tiny insects, worms, and algae that live on the bottom of the river and nearby lakes. They did this by dragging a net through the water near the bottom and stirring up the riverbed / lake bottom from time to time. They sent the samples to the lab.
The labs will look at the types of animals and plants, and the amounts found in the samples. The results help us understand the food available for fish and the feeding relationships of life in the water.
Looking from Above
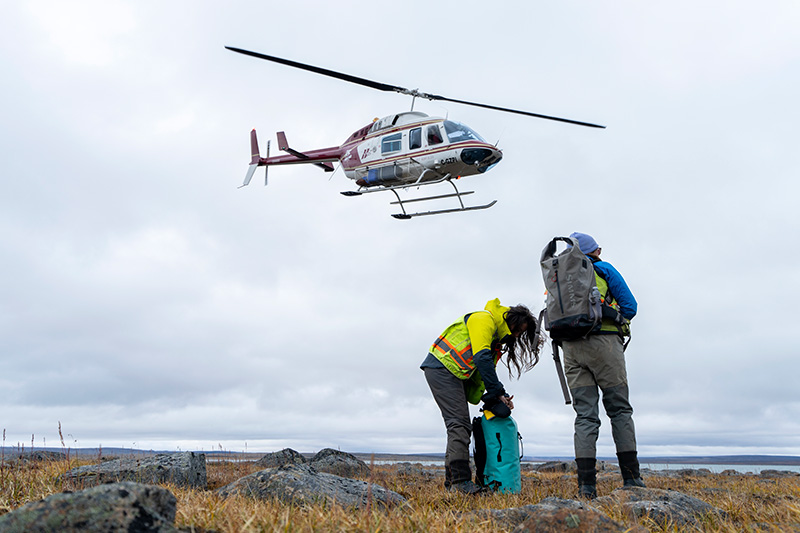
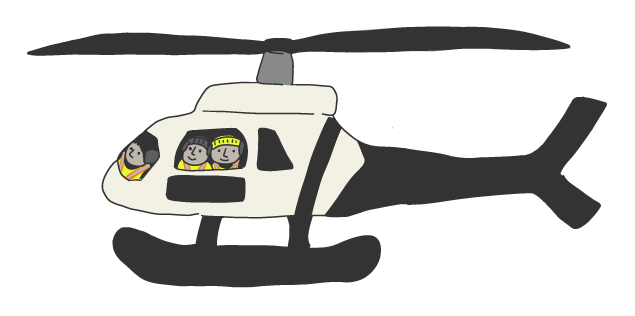
The aquatics crew flew over the whole area in helicopters to look at fish habitat, checking how big the rocks in the rivers were, the water depth, and how fast the water was moving.
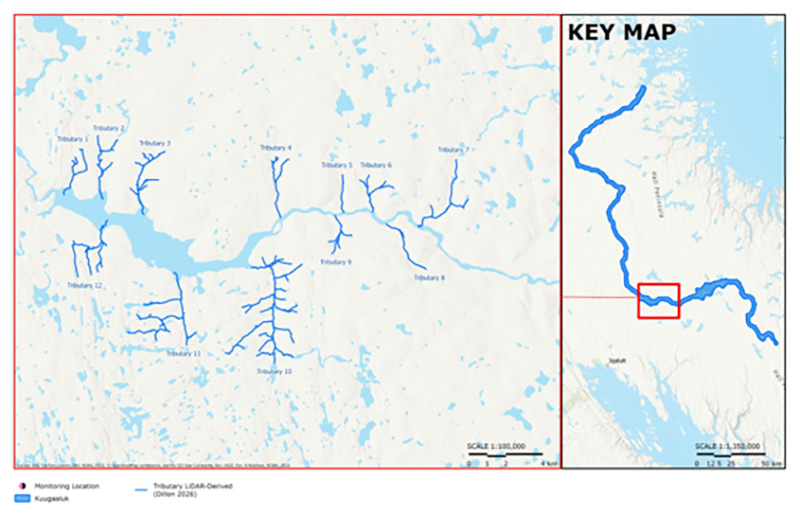
12 tributary streams were checked, in 300m intervals and at important places where the habitats changed, throughout the proposed reservoir area and the river.
Riffle and run habitat types were the most regularly observed:
- Riffle: shallow water, flowing fast and breaking over boulders and large rocks
- Run: slightly deeper water, flowing smoothly, usually with gravel, sand, and smaller cobbles on the bottom.
Studying Habitats
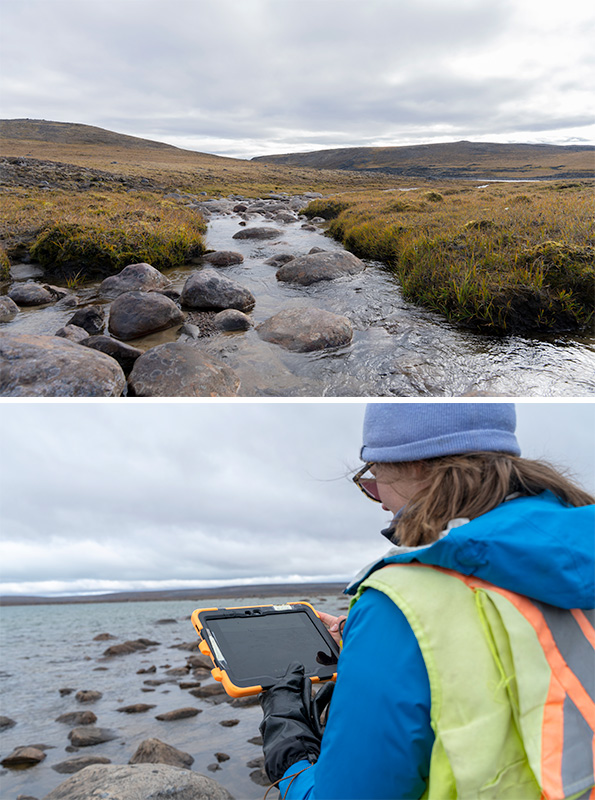
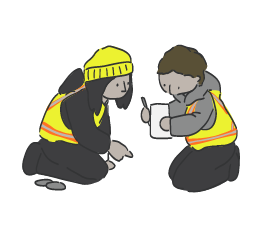
Field crew members walked along 12 small streams to write down detailed descriptions of the habitats they saw. They measured how wide and deep the water was, how fast it was flowing, and what the stream beds were made of.
LiDAR Data Collection
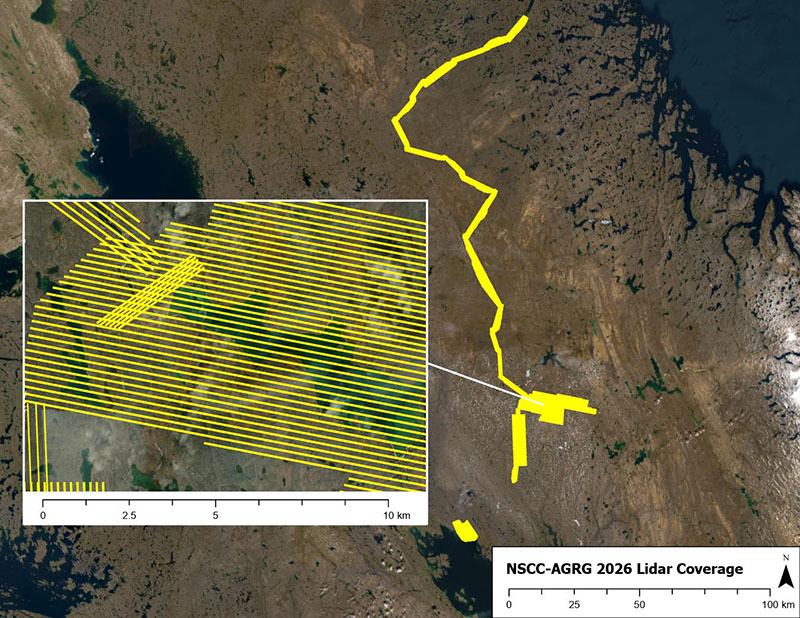
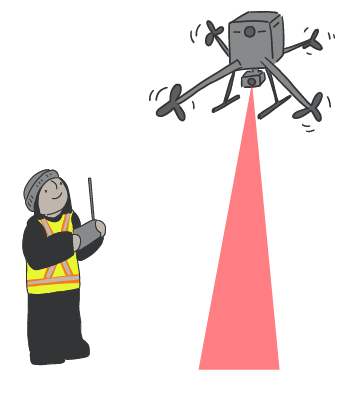
LiDAR, which stands for Light Detection and Ranging, uses lasers to measure the shape of the land from above. This creates high-quality 3D maps of the ground.
LiDAR uses lasers from a drone to create detailed 3D maps of the land and water. LiDAR surveys were done around the proposed reservoir area and downstream river, covering 31 km². This information helps the team understand fish habitat in smaller streams near the proposed reservoir.
Research
Before going into the field, the aquatics team reviewed other water studies from the Chidliak Project (collected since 2020) as well as information from Fisheries and Oceans Canada about Arctic char in the area.
This information helped the team understand what is already known about the lake, river and streams at Kuugaaluk. The new study results will be compared with this older information to build a picture of conditions today and help understand how the proposed project could change the area's water system.

Char at Kuugaaluk
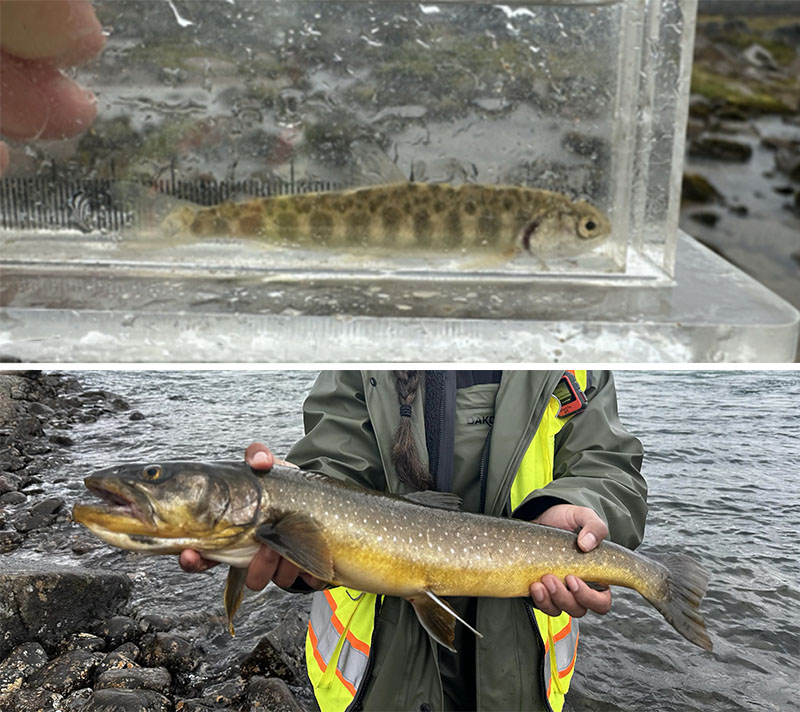
The 63 Arctic Char caught at Kuugaaluk came from different places:
- 33 were from the lake
- 30 were from the river downstream of the proposed reservoir area
Arctic char was the only fish species observed.
Young char are using the small streams with gravel and small rocks on the bottom, while big adult char are in deeper main river and lake habitats.
More information about fish is coming soon.
Char at Kuugaaluk
The 63 Arctic Char caught at Kuugaaluk came from different places:
- 33 were from the lake
- 30 were from the river downstream of the proposed reservoir area
Arctic char was the only fish species observed.
Young char are using the small streams with gravel and small rocks on the bottom, while big adult char are in deeper main river and lake habitats.
More information about fish is coming soon.
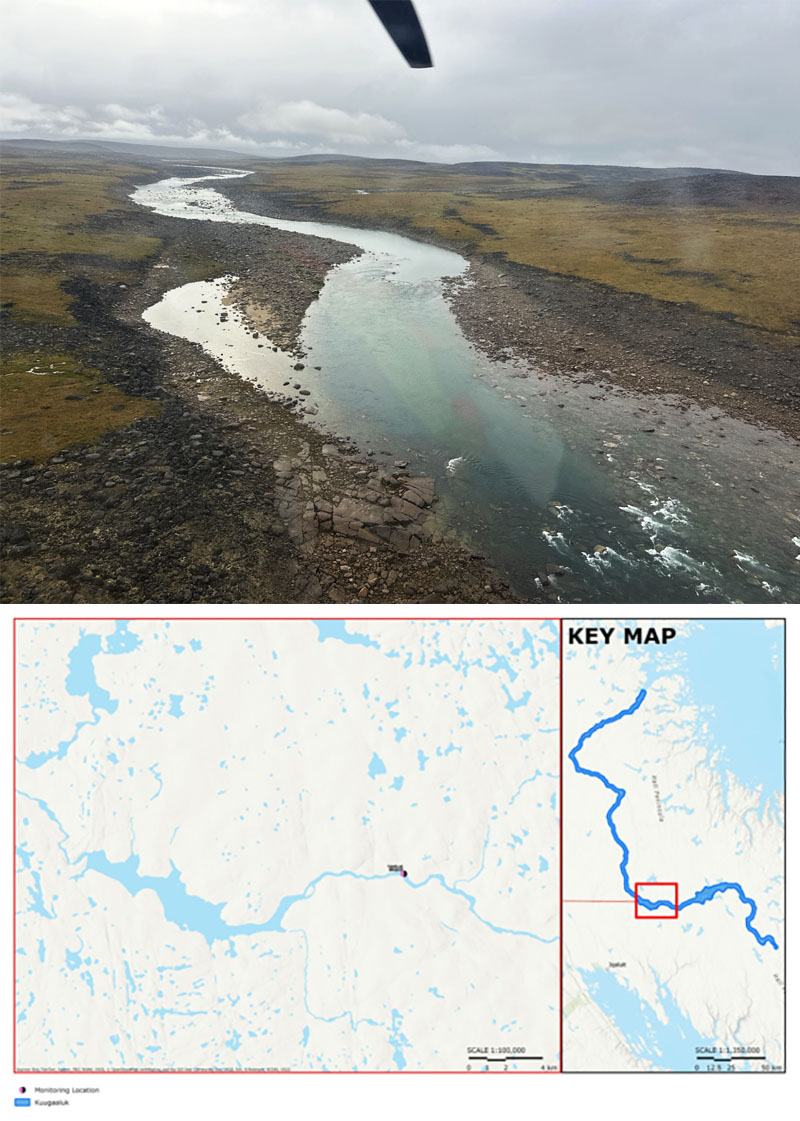
Upstream from Kuugaaluk
The team collected samples from upstream lakes and rivers to learn more about water quality and habitat conditions. The results will contribute to understanding what the aquatic environment is like today and provide a benchmark for future environmental assessments and project planning.

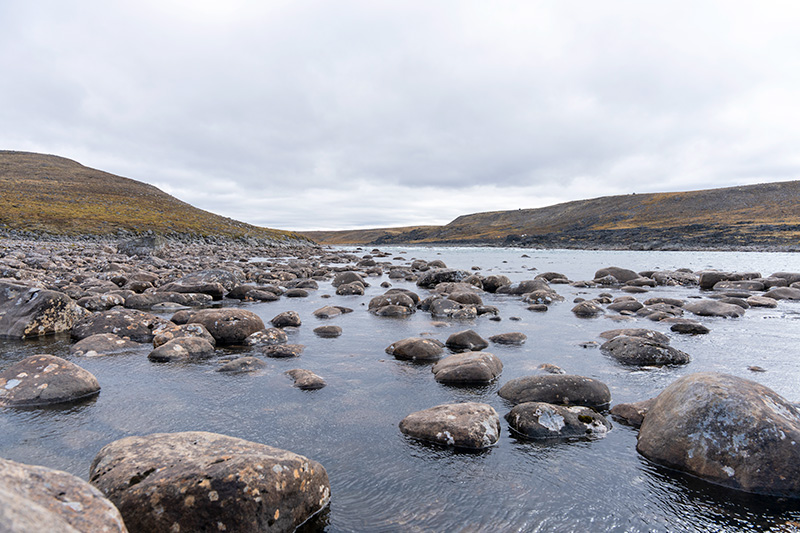
Aquatic Habitat Results
The 2026 surveys found a variety of fish habitats along the river and in the smaller streams that flow into it.
The smaller streams have a mix of:
- Shallow, fast-flowing water where sunlight reaches the bottom
- Deeper, slower-moving pools with little or no sunlight.
Young char were found in the shallow areas, and the bigger older char were found in the deep areas.
Aquatic Habitat Results
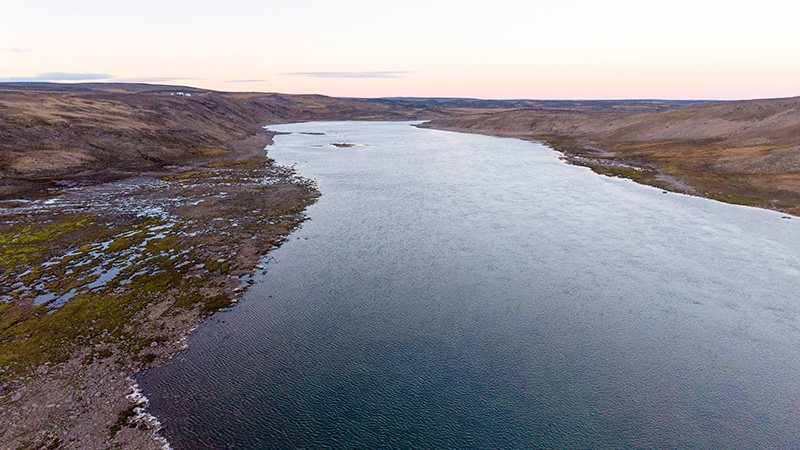
The 2026 surveys found a variety of fish habitats in the lake.
There are:
- Shallow areas where sunlight reaches the bottom
- Deeper areas with little or no sunlight.
Larger adult Arctic char were found in deeper parts of the main river and lakes.

Water Levels
The lake and river at Kuugaaluk are mainly fed by melting snow and ice. In spring 2026, water levels rose quickly, increasing by as much as 50 cm in one day. Water levels peaked on June 21 and dropped over the following days.
Water levels continue to decrease through the fall, and much of the river freezes during winter. Measurement tools have been left at the site to collect more data during the 2027 spring melt.
Snow Melt
Snow surveys showed that average snow depth nearly doubled between March and April 2026.
The snow also became heavier and more compacted in late winter. The amount of water stored in the snowpack also about doubled.
This information will be used in computer models that predict how water moves over the land throughout Kuugaaluk area.
Photos from the camera network showed that most of the spring snowmelt happened over about five weeks, from early June to mid-July.

Water Quality Results
The Kuugaaluk River is a clear, fast-flowing river that is mainly fed by melting snow.
Water testing showed that the river has low levels of dissolved minerals. The water was generally very clear, with very little cloudiness or dirt in the water.
In July 2026, heavy rainfall washed dirt into the river, causing the water to become cloudier for a short time.
Water temperatures ranged from 6°C to 14°C during the 2026 field season.

Sediment Quality Results
Lab work is still not finished for sediment quality. More information is coming soon.
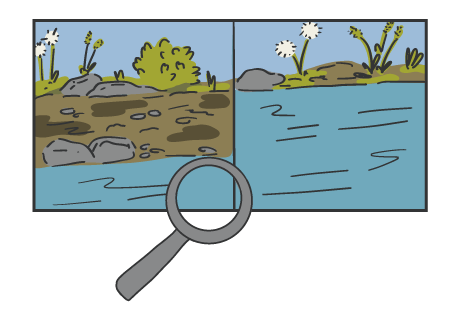
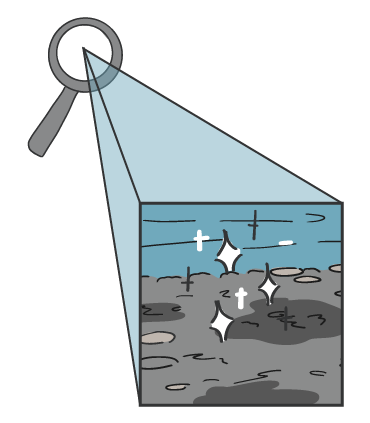
A layer of fine, soft sediment is on the bottom of the lake, put there by the river and smaller steams. Understanding what's going on with the sediment is important because it supports aquatic habitats, affects water quality, and gives a home for plants and algae, which are the base of the food chain.
Tiny Water Bugs & Plants
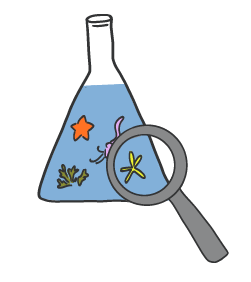
Lab work is underway to learn about the small plants, algae, and animals that live on the bottom of the lake, river, and streams.
These tiny plants and animals tell us a lot about water quality and ecosystem health, and the results will help with understanding what's going on in aquatic habitats in the study area, plus support future planning.
Lake Water
The proposed reservoir is at the lake at Kuugaaluk. It has water always flowing through it.
Study results show that the lake has shallow shores that gradually slope towards the deeper water in the centre. The main line through the middle where water flows is more than 10 m deep. Maximum depths of 16 to 18 m have been recorded.
The team is also studying how water temperature changes at different depths and continue to learn about water quality to better understand this lake.
Camp Life
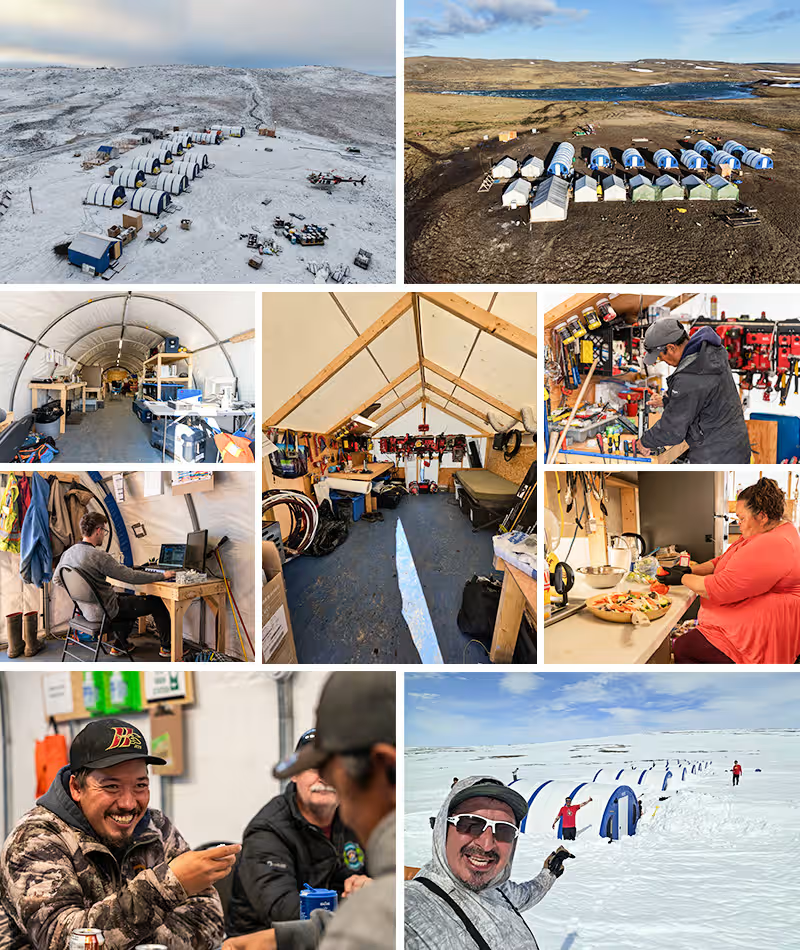
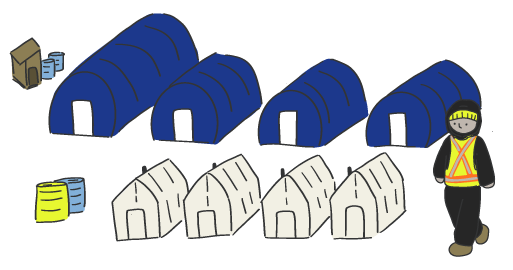
This temporary camp was home base for all teams working at Kuugaaluk throughout the 2026 field season. 24 tents were set up for sleeping, eating, and working. An NNC Site Manager, a Health and Safety Monitor, two helicopter pilots, and a helicopter mechanic also stayed at the camp at all times. At its busiest, there were 48 people staying at camp.
Archaeology
The archaeology team completed two surveys at Kuugaaluk from June 21 to July 22 and August 30 to September 6, for a total of 40 field days. Local Inuit supported the team by helping identify archaeology sites, sharing knowledge of how Inuit used the land in the past, and providing recommendations to protect important cultural sites as the project moves forward.
Cultural features identified during the surveys were photographed, documented, and reported to the Government of Nunavut’s Department of Culture and Heritage. All features and artefact were left in place.
Thank you to our crew and local Inuit knowledge holders who made this work possible.
- Click on the people and equipment to learn what the team did during the field season.
- Click on the magnifying glasses and other objects to see what was found.
- Click outside the text boxes to hide them again.
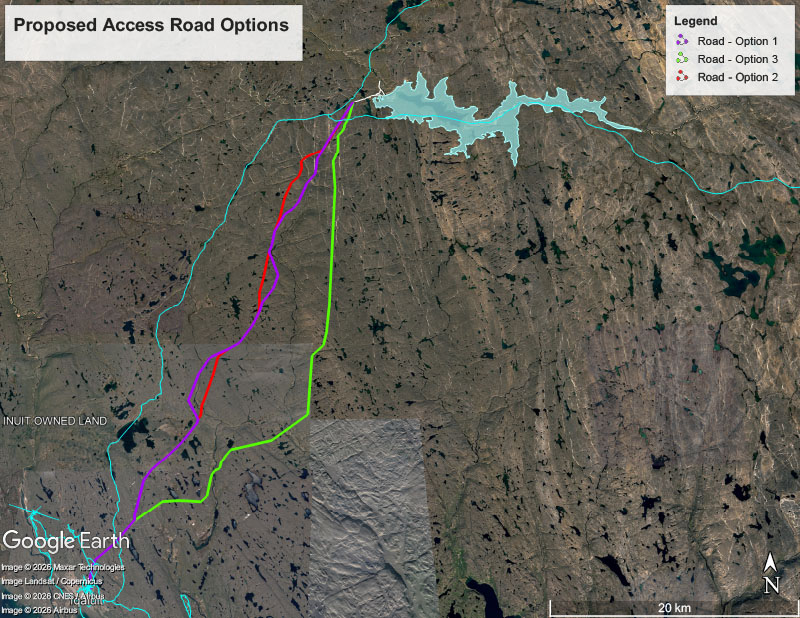
Study Area 2: Proposed Access Road
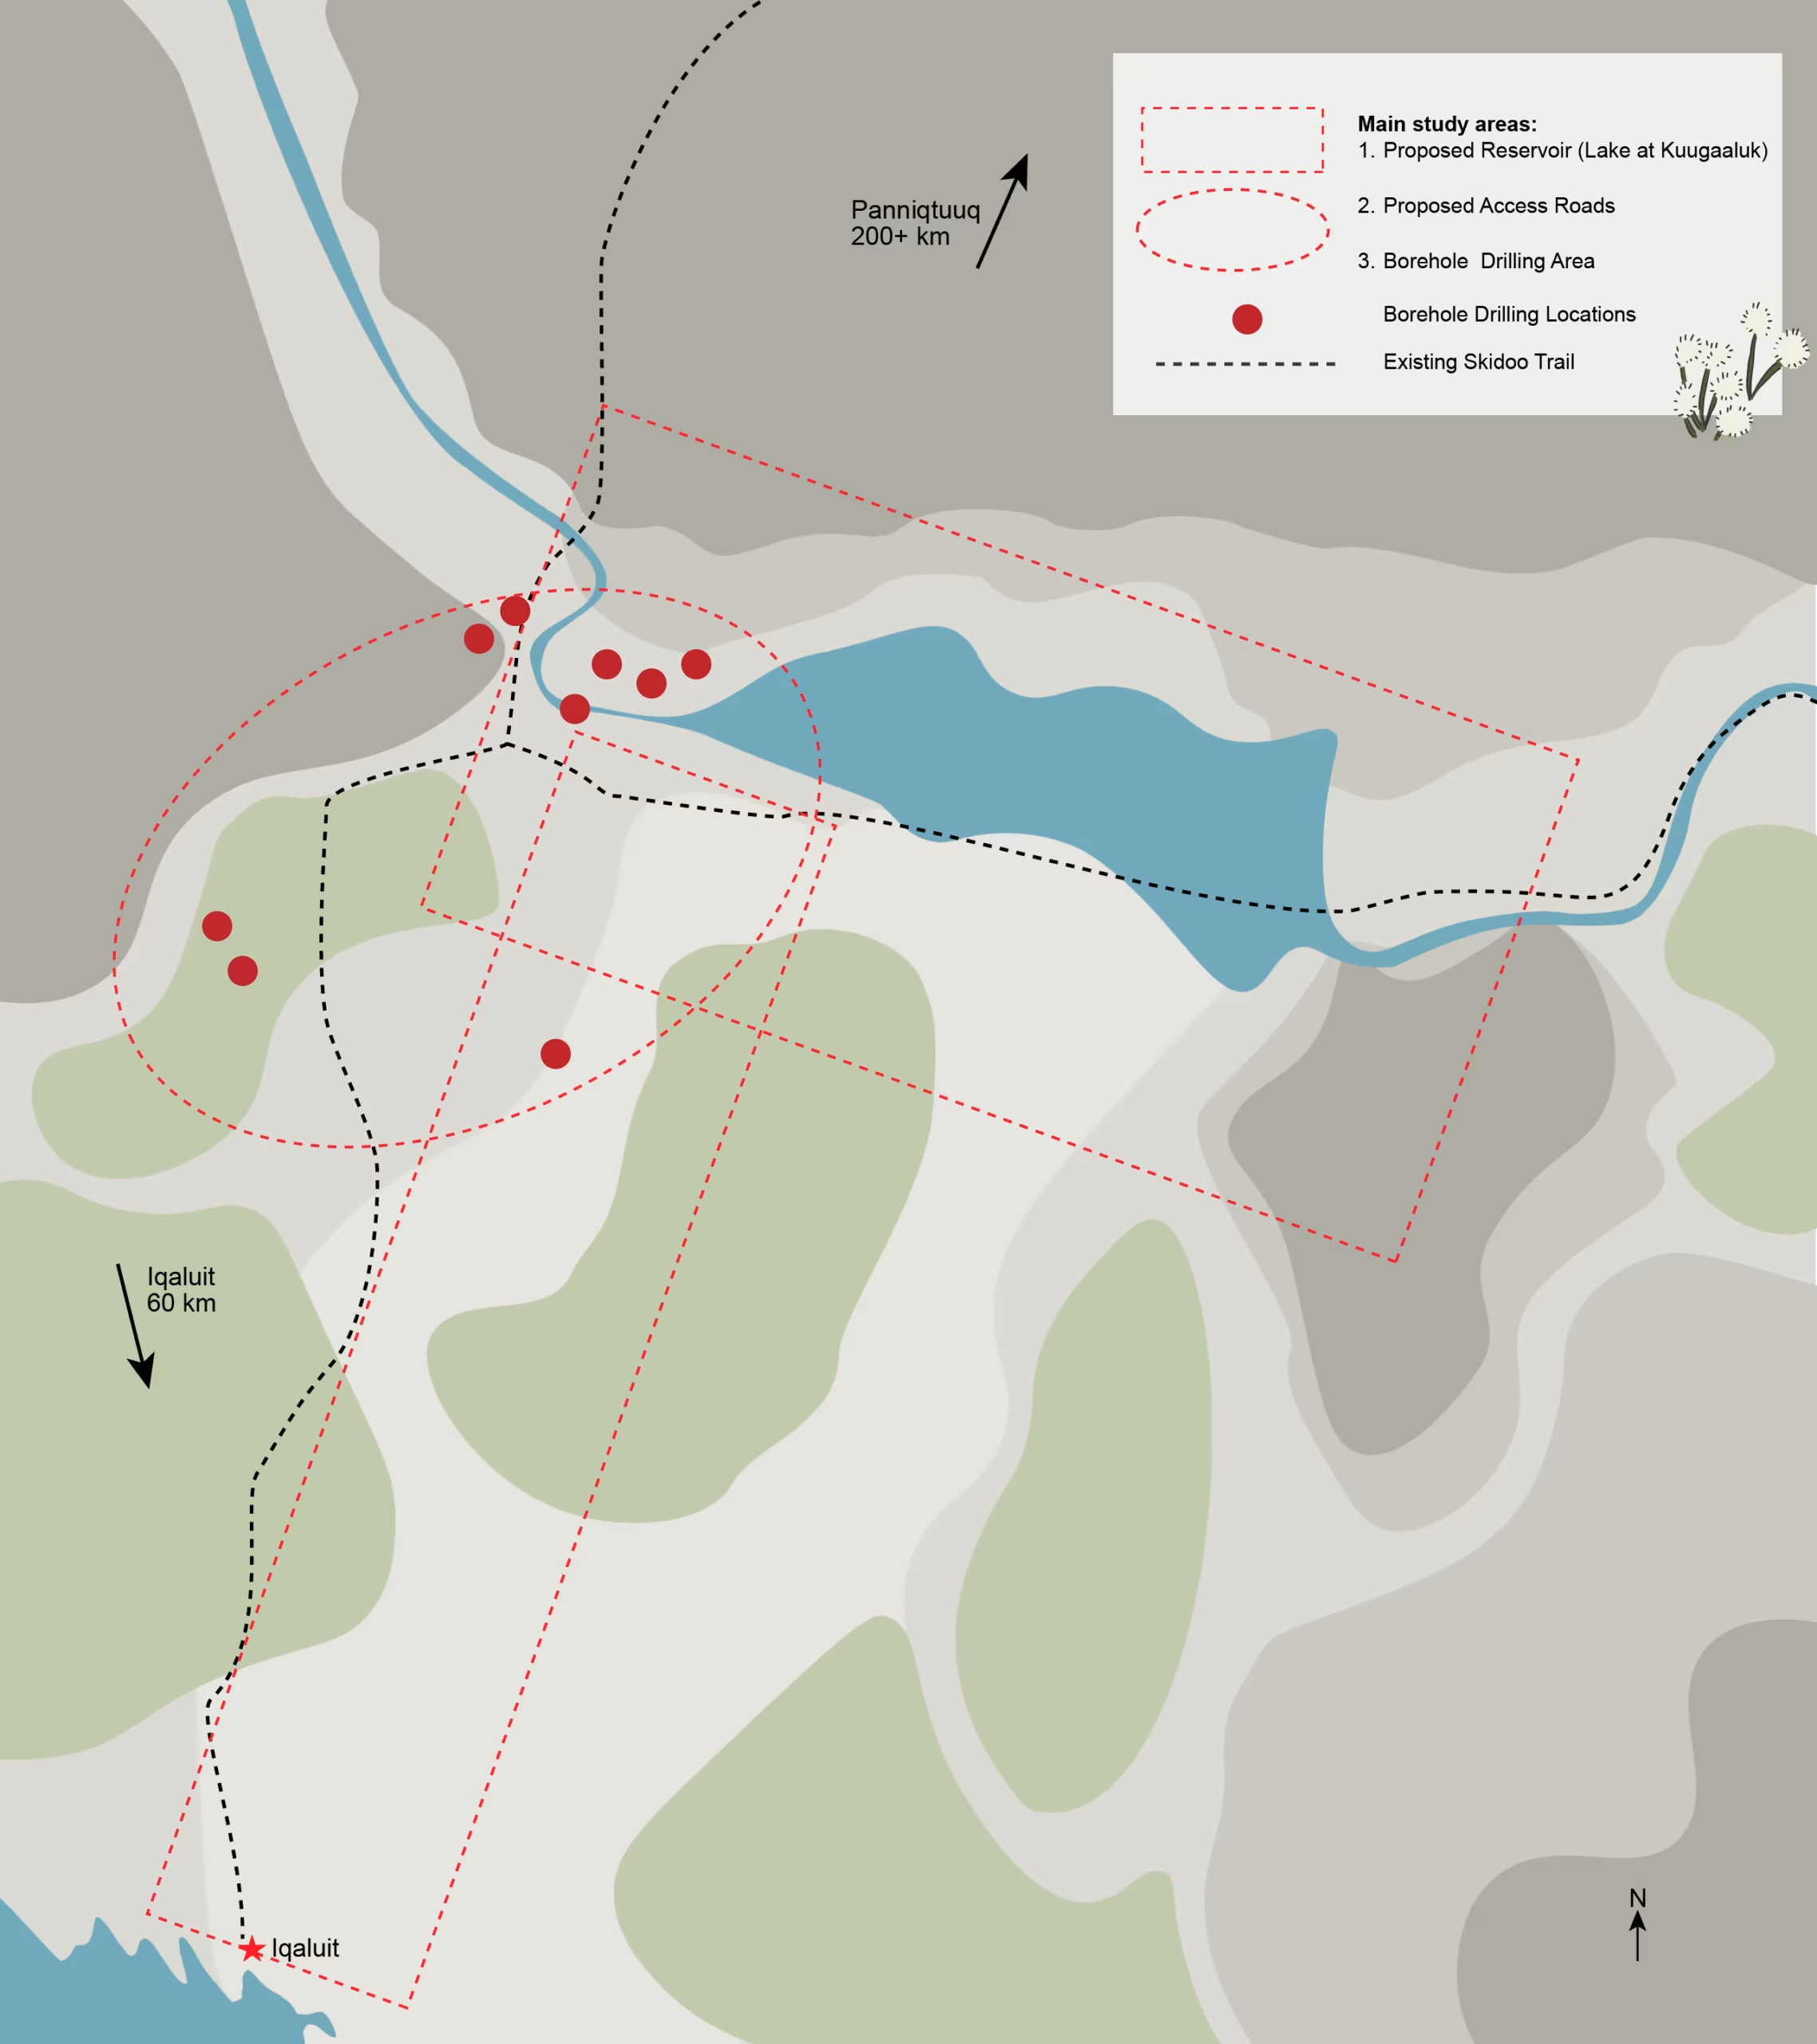
This year, the archaeology team mainly surveyed the area between Iqaluit and Kuugaaluk, where a proposed access road could go. The team walked the land, looking carefully for signs of Inuit life from long ago. They identified 70 archaeology sites in this area. The most common things found relate to travel, navigation, and hunting, especially Inuksuit or marker stones.
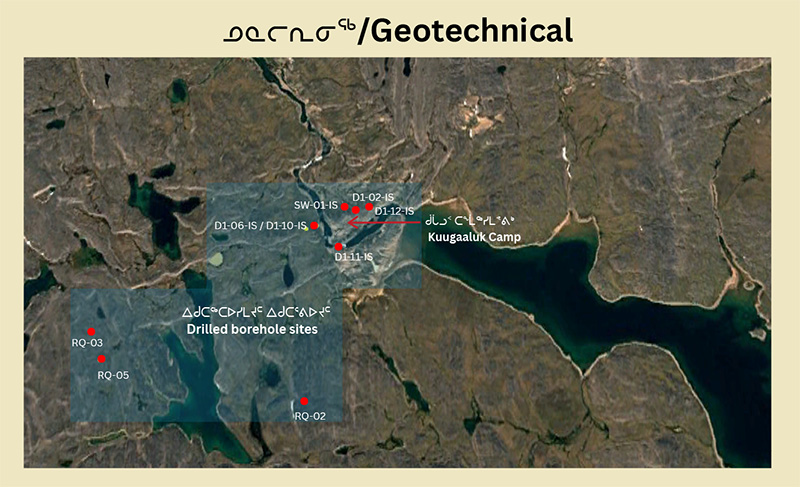
Study Area 3: Borehole Drilling Locations
Before any geotechnical drilling could happen, the archaeology team first checked each spot where drilling was planned, and the area around them.
Through this search, 7 archaeological sites (mostly already known about, from the 2025 study) were found near planned drilling spots and protected.

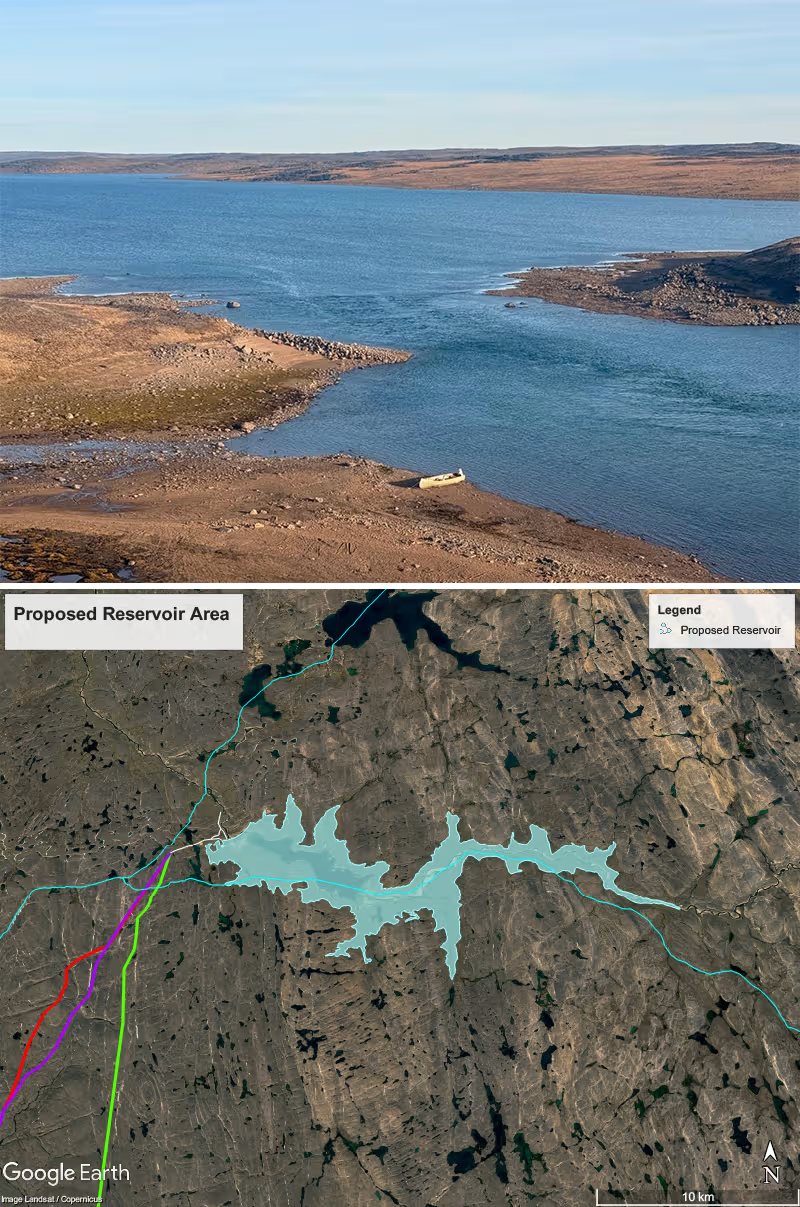
Study Area 1: Around the Lake
Environmental researchers from other study teams made notes on anything they noticed in the proposed reservoir area that the archaeology team should double check. In response, the archaeology team returned to those specific areas (first studied in 2025) by boat along the lake shore and by foot.
By working together this way, the archaeology team identified 19 archaeology sites, mostly to do with hunting: Inuksuit or marker stones, meat caches, and hunting blinds.
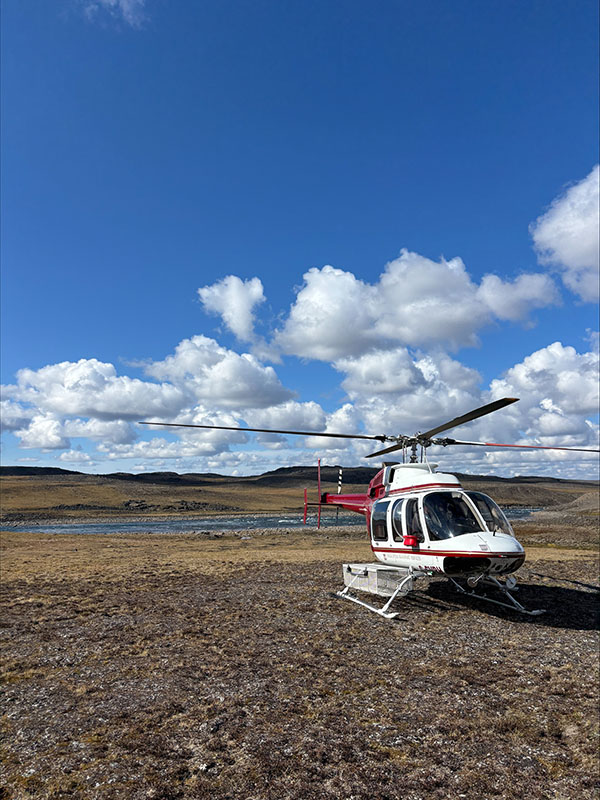
Getting Around Kuugaaluk
The archaeology team travelled to the survey areas each day mainly by helicopter or, depending on the location, by boat.
Walking Survey
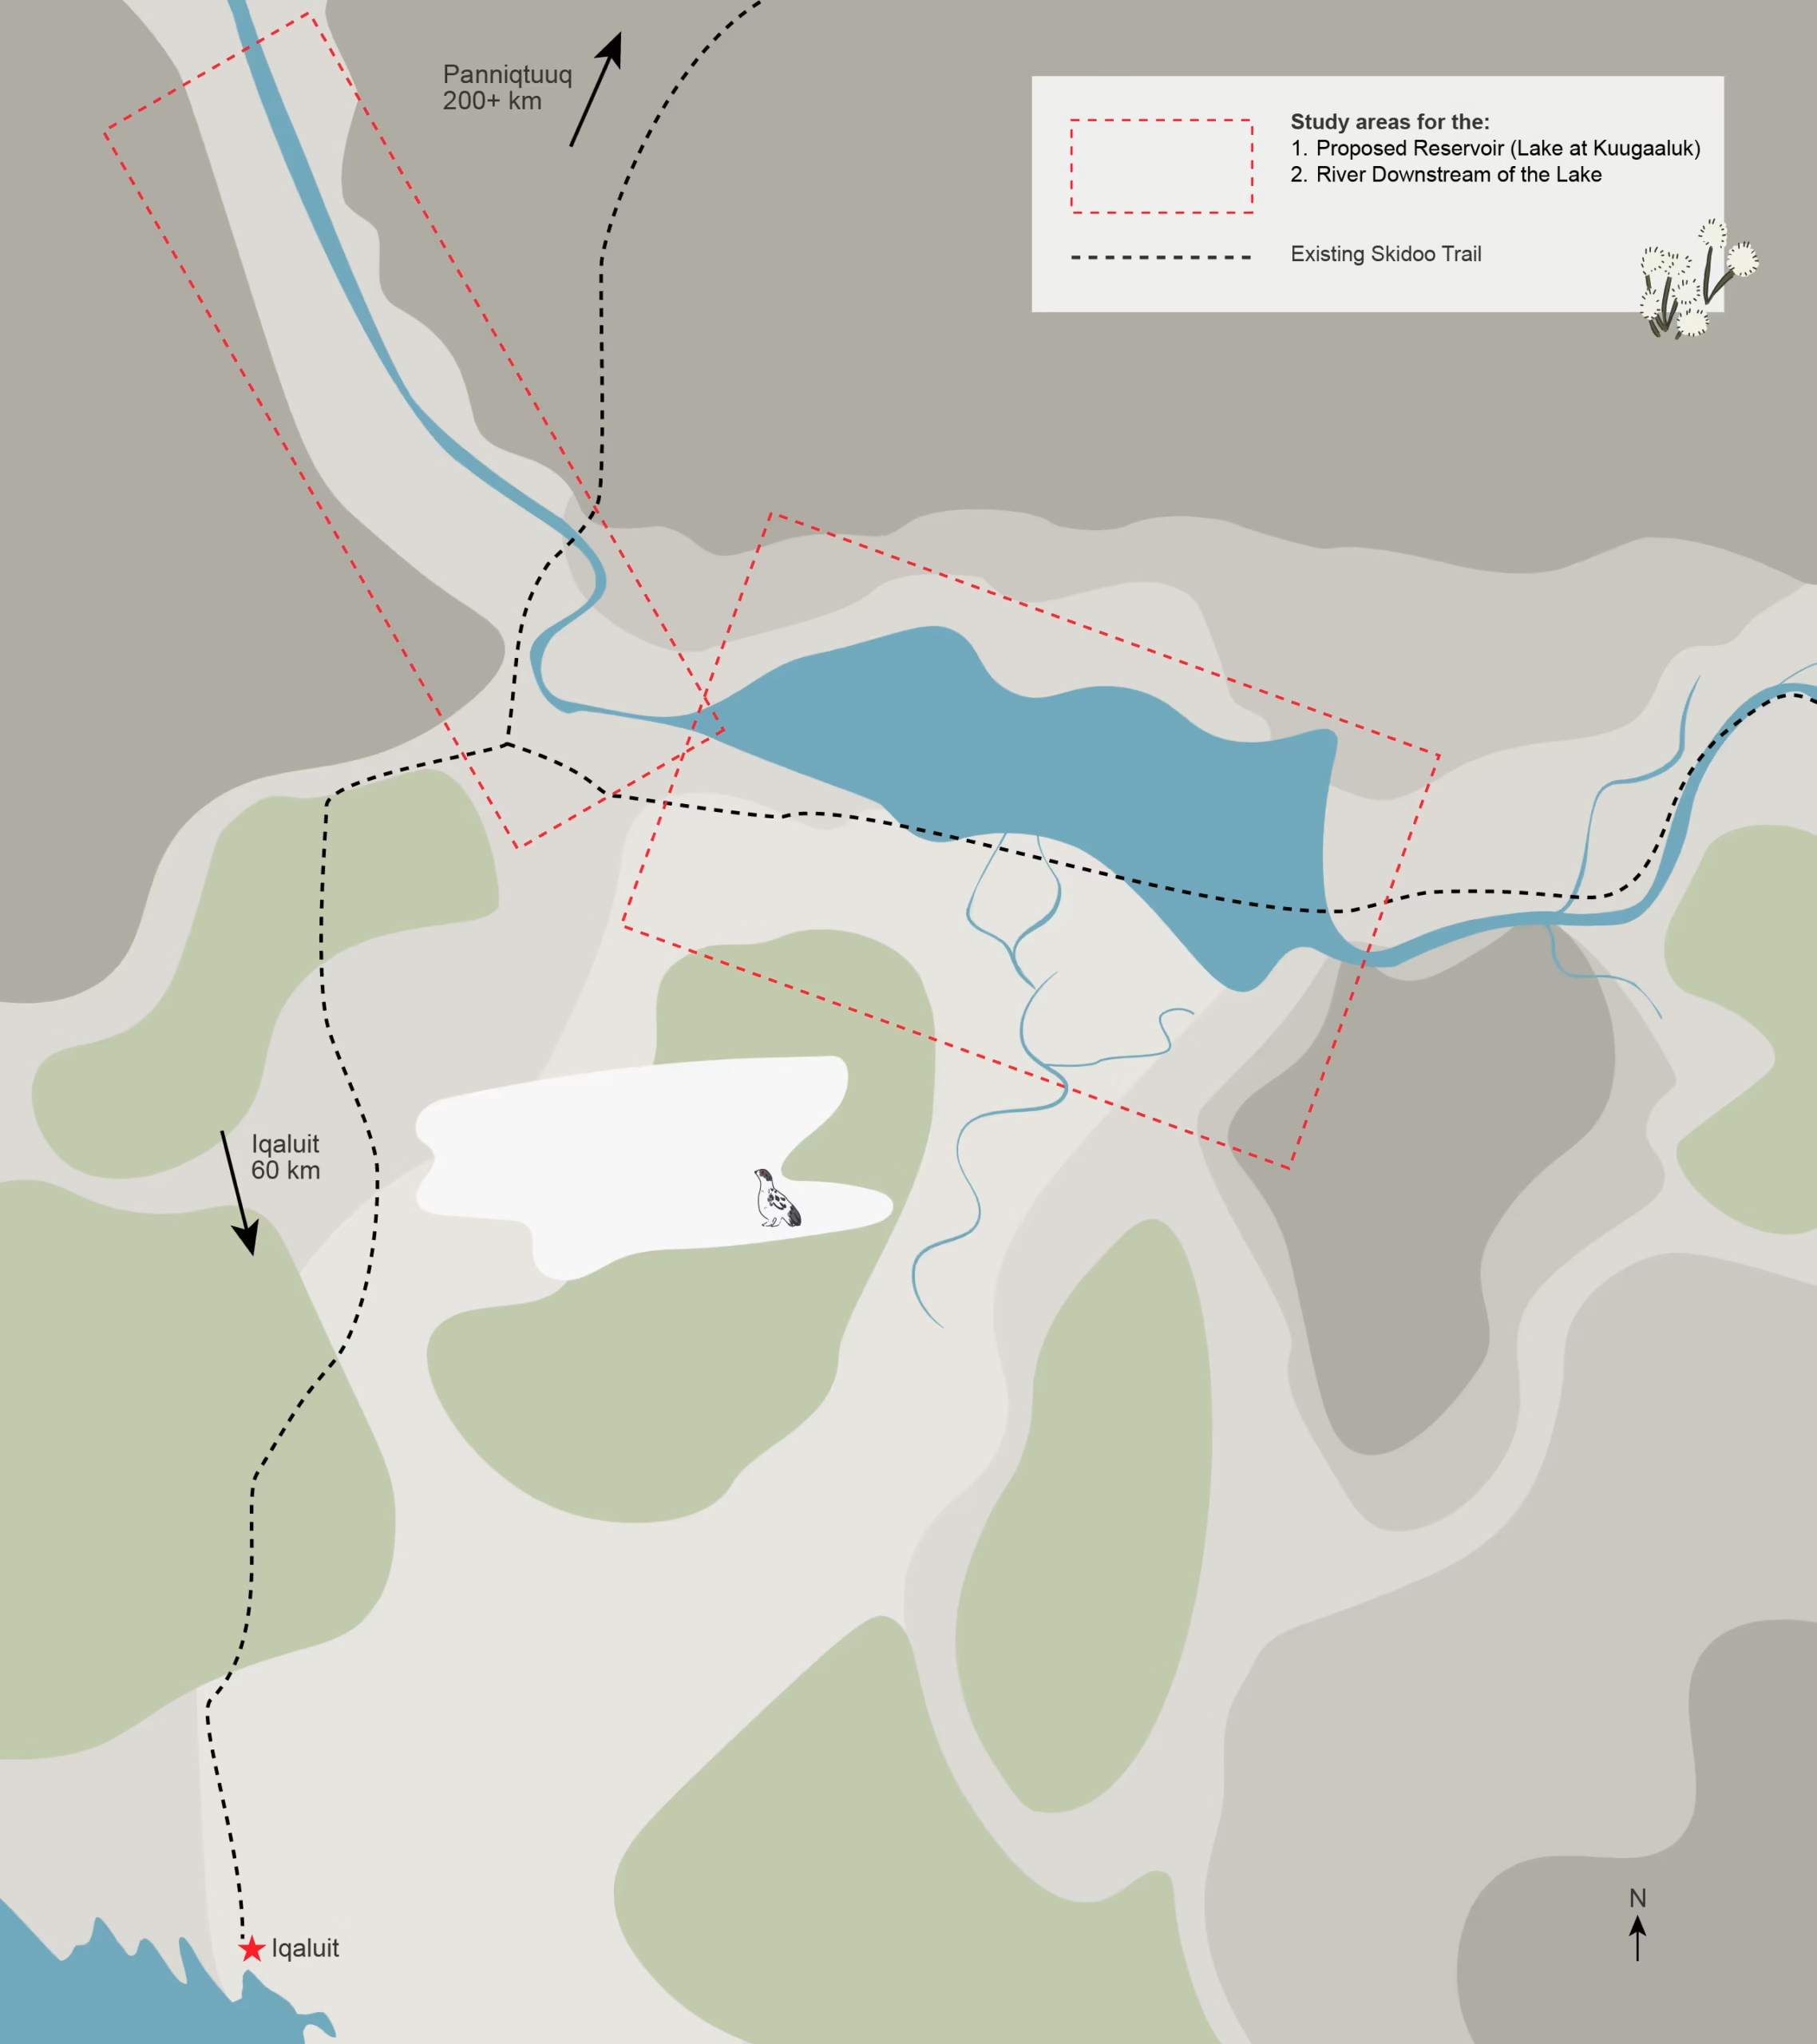
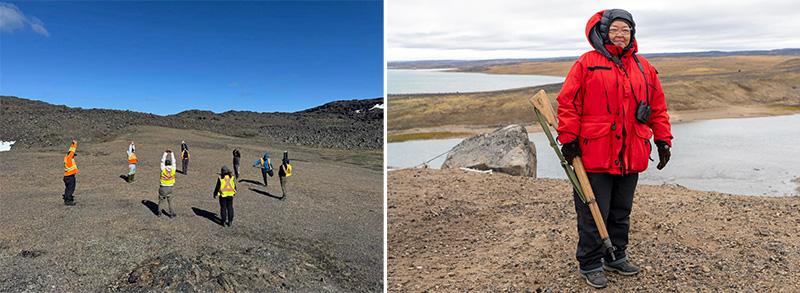
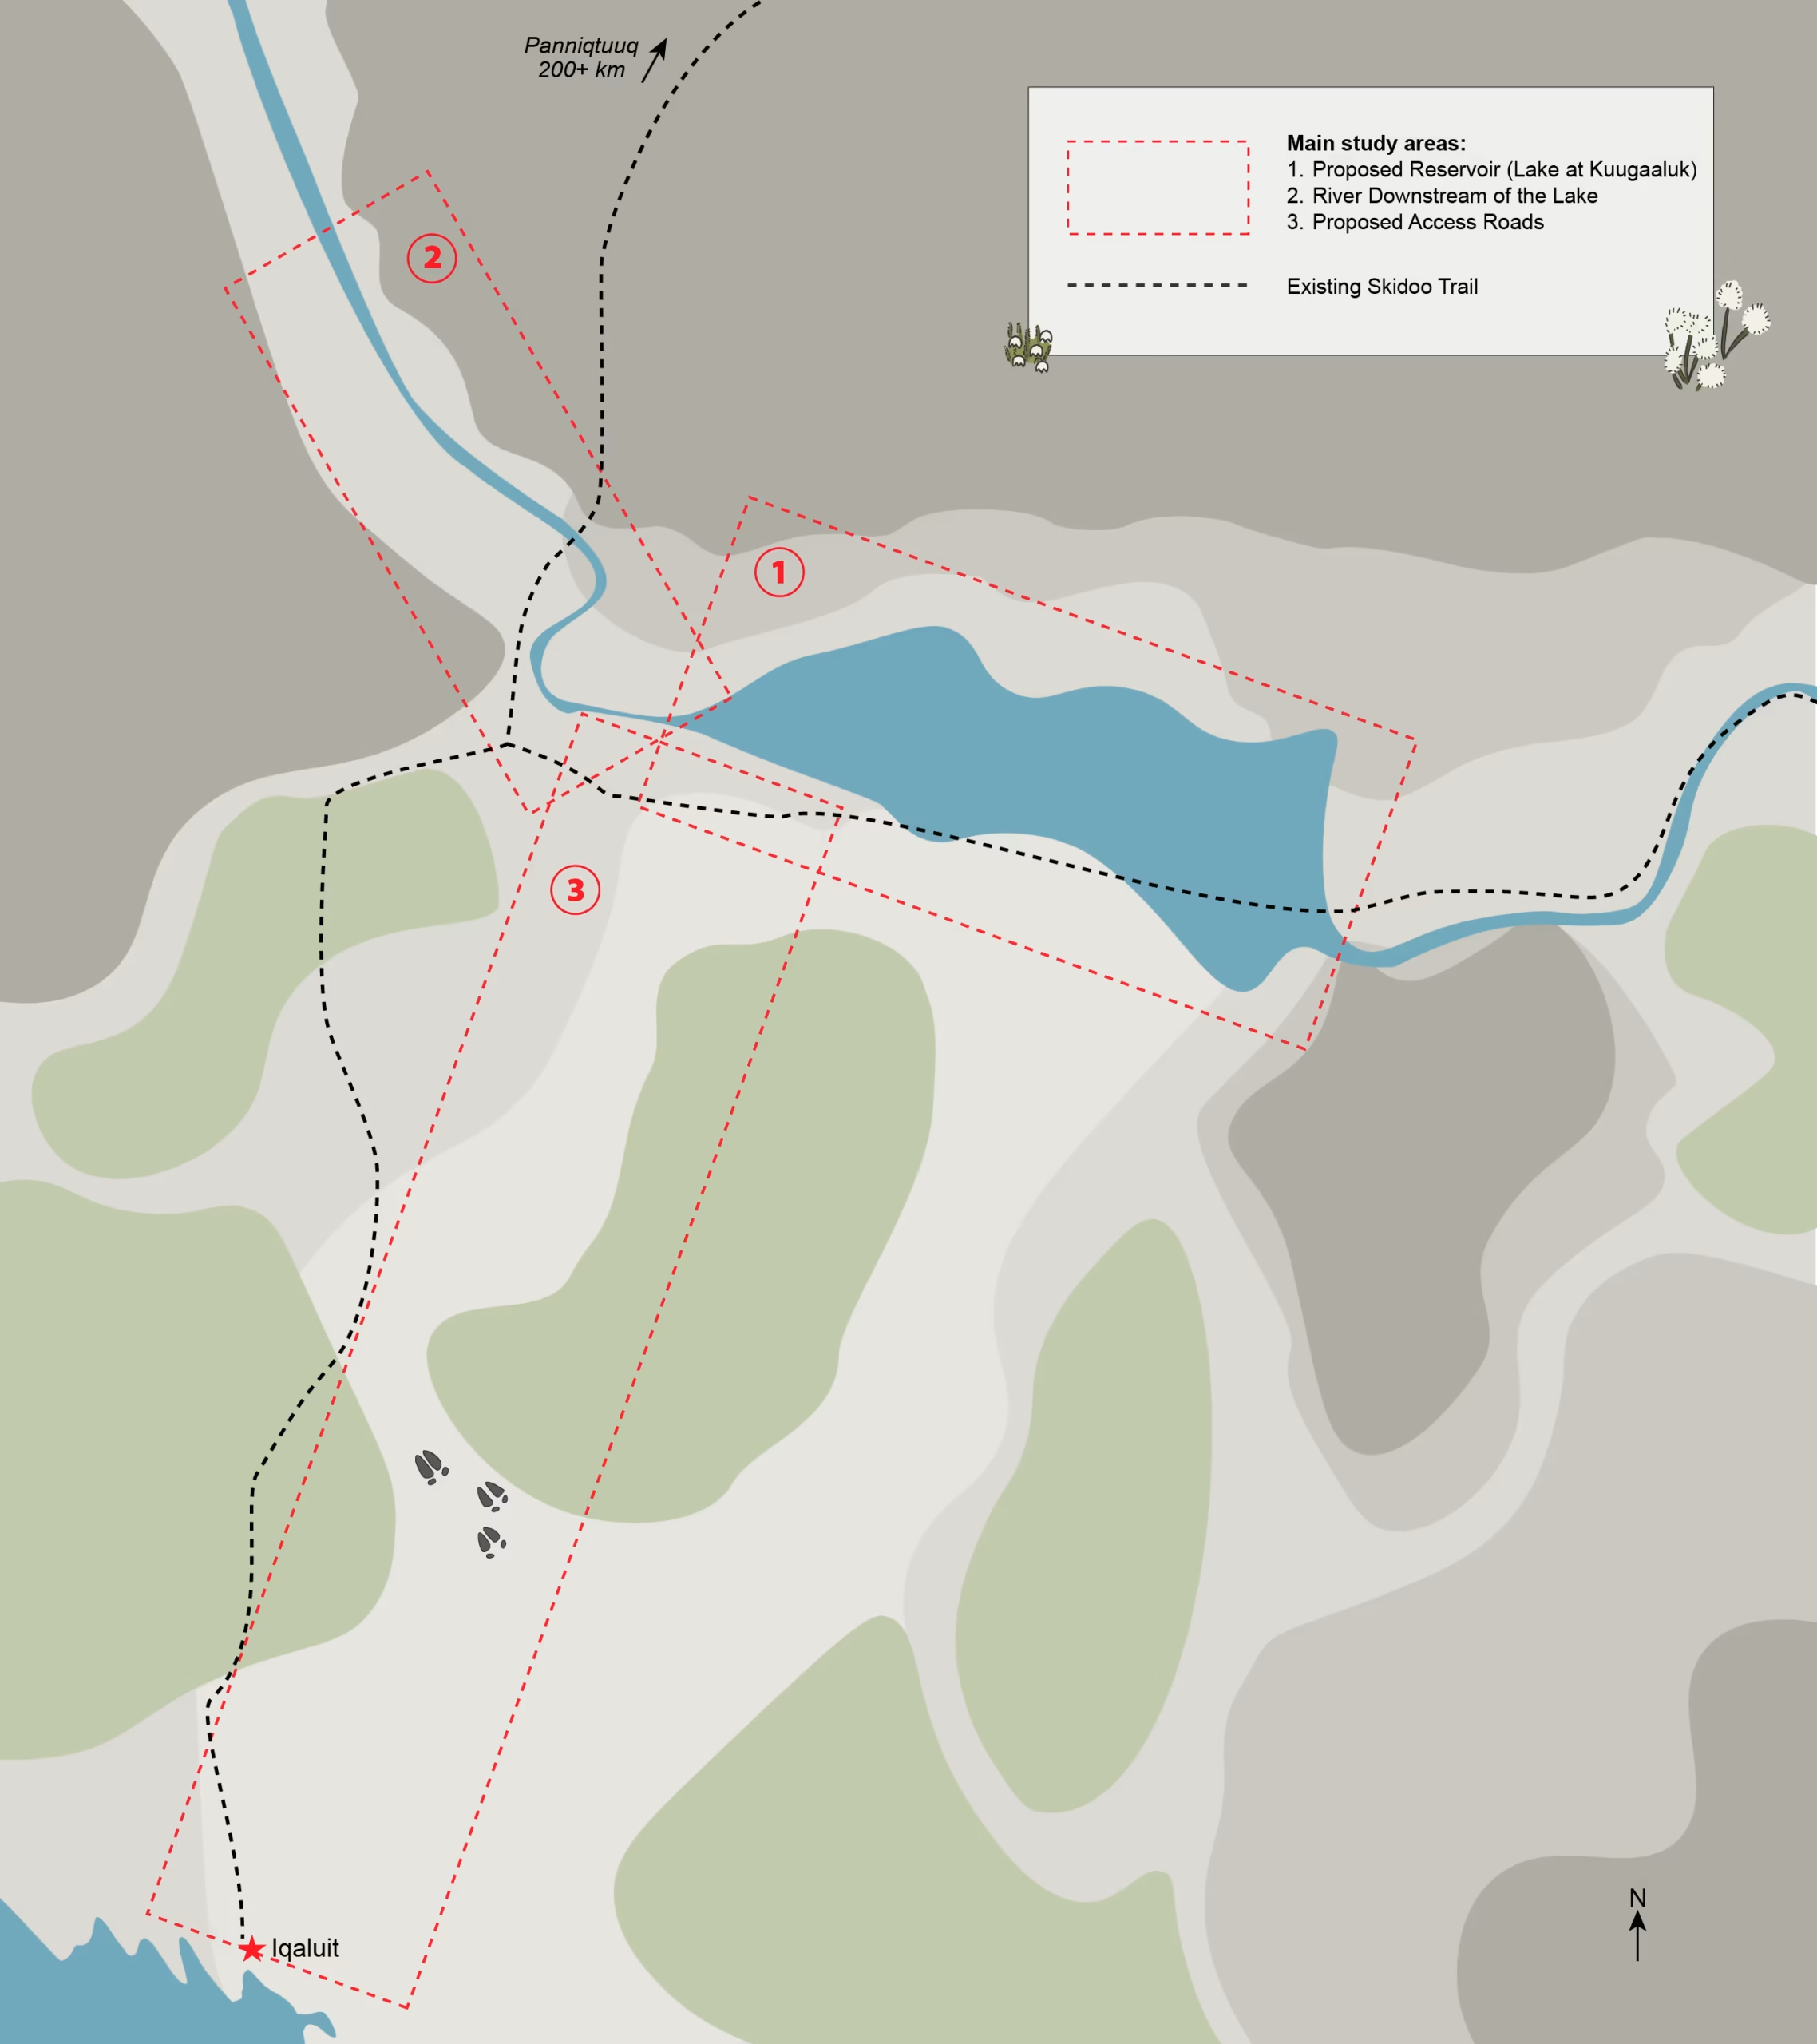
Archaeology teams included Inuit assistants from Iqaluit and Panniqtuuq, local wildlife monitors, and a licensed Archaeologist (who held the permit for this work from the GN). Together, they searched three study areas, shown on this map in red dotted outlines. They carefully scanned the ground looking for cultural features and signs of Inuit life from long ago.
The team can be seen in this photo doing a group stretch before the walking survey.
Making Records
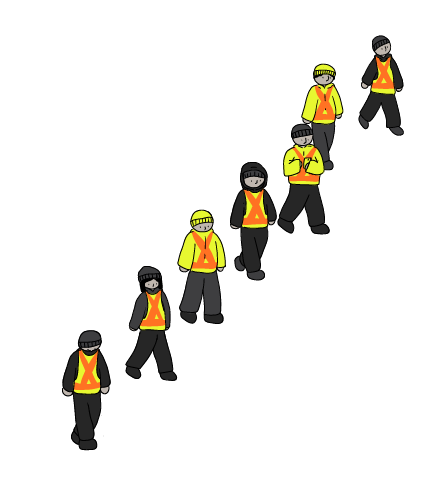
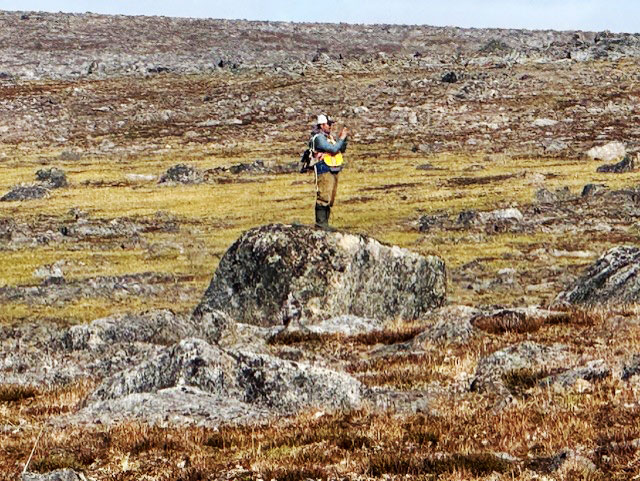
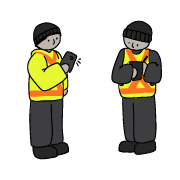
The team took photos of each feature they found and recorded its GPS location. They wrote down what the feature was (for example, tent ring or marker stone) and its condition. When possible, the team also recorded the age or cultural group they thought the site might belong to.
The ground around each feature was checked for other artifacts or animal bones.
Nothing was collected, changed, or disturbed.
Protecting Archaeology Sites
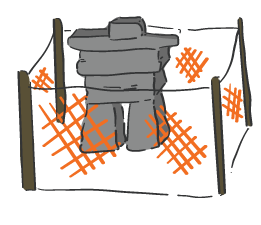
To make sure that archaeology sites would not be disturbed during ground studies, the team put wooden posts around the sites located near borehole drilling areas. The posts made sure these areas were clearly marked, avoided, and kept safe while work was underway and protected a 70m wide area around each archaeology site (a 35m radius, with the site at the centre).
Archaeological Sites
An archaeology site is the place or area where evidence of past human activity was found.
96 archaeology sites were recorded throughout the study areas during the 2026 field season. There were some stone features found that could not be identified. Those were recorded, but not counted in this tally.
Archaeology sites are different from artefacts. An artefact is an individual object made and/or used by people, such as a stone tool. No artefacts were found.
Tent Ring
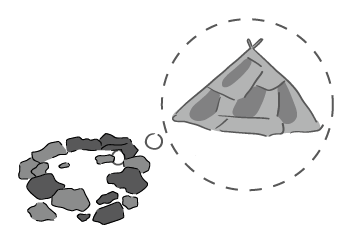
Tent rings are made of heavy rocks and boulders, placed in a circle, to weigh down and anchor the base of tents.
About 18 tent rings were found in the study areas this year.
Sometimes it's hard to tell if stones were used as a tent ring or a wind shelter. This is why the count is "about 18".
Hearth
A hearth is a place where people made fires. Hearths may be found inside a winter tent or house, outside a tent ring, or on their own.
10 hearths were found in the study areas.
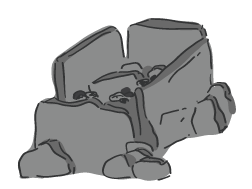
Wind Shelter
A wind shelter is a wall made of stones to protect people from the wind. It was used as a temporary shelter or campsite. Wind shelters can take different forms, such as:
- a half-circle of stones built against a large boulder or mountainside
- a small oval-shaped ring of stones, or
- a line of stones
About 8 wind shelters were found in the study areas.
Sometimes it's hard to tell if stones were used as a tent ring or a wind shelter. This is why the count is "about 8".
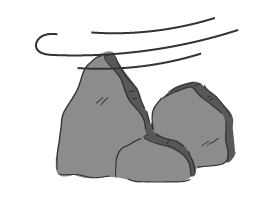
Hunting Blind
A hunting blind is a simple rock wall that a hunter hides behind while waiting for animals to come close. In some areas, multiple hunting blinds were found close together, further suggesting that caribou hunting was likely the main activity in this area.
8 hunting blinds were found in select areas around Kuugaaluk.
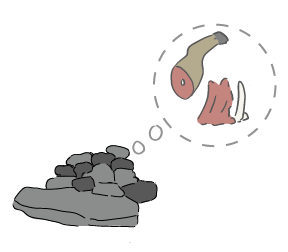
Meat Cache
A meat cache is a pile of rocks used to cover and protect harvested meat. Caches can be built against a rock ledge or boulder, on top of a boulder, or in cracks of bedrock covered by flagstones (creating a storage space).
12 suspected meat caches were found in the study area.
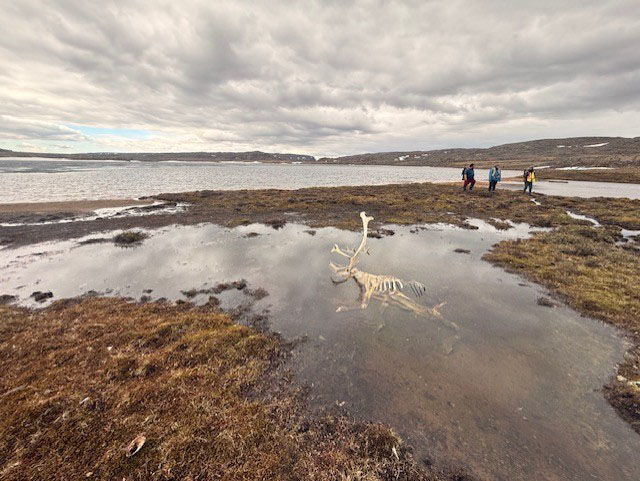
In some of the meat cache sites, caribou bones were observed in or around the cache.
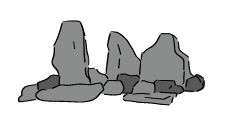
Marker Stone
An Inuksuit, or marker stones, is a pile or line of rocks on the land that share important information. Inuit used them to show safe travel routes, good hunting, or places to avoid. Hunters also Inuksuit to help guide their way on long trips.
Marker stones were the most common archaeology feature found in the 2026 surveys.
Licensed Archaeologist
The head archaeologist, hired from Campfire Archaeology and Heritage Ltd., had a permit approved by the Inuit Heritage Trust and the Government of Nunavut’s Department of Culture and Heritage to complete archaeology work.
Local Inuit supported the archaeology team by helping identify archaeology sites, sharing knowledge about how Inuit used the land in the past, and recommending ways to protect important cultural places in the Kuugaaluk area.

Camp Life
This temporary camp was home base for all teams working at Kuugaaluk throughout the 2026 field season. 24 tents were set up for sleeping, eating, and working. An NNC Site Manager, a Health and Safety Monitor, two helicopter pilots, and a helicopter mechanic also stayed at the camp at all times. At its busiest, there were 48 people staying at camp.
Downstream of Kuugaaluk
The aquatics team traveled downstream from the lake at Kuugaaluk to study the river closer to Irvine Inlet and Cumberland Sound. They collected information about the waters and surrounding environments, as they are today. This will help the team understand the river and predict how it could change if the proposed water power project moves forward.
More studies are needed before we can understand how the project could affect the river downstream and Cumberland Sound. In 2027, the team will also study the marine environment in Cumberland Sound. These studies will all contribute to a better understanding of the area and safe planning for the proposed project.
- Click on the people and equipment to learn what the team did during the field season.
- Click on the magnifying glasses and other objects to see what was found.
- Click outside the text boxes to hide them again.
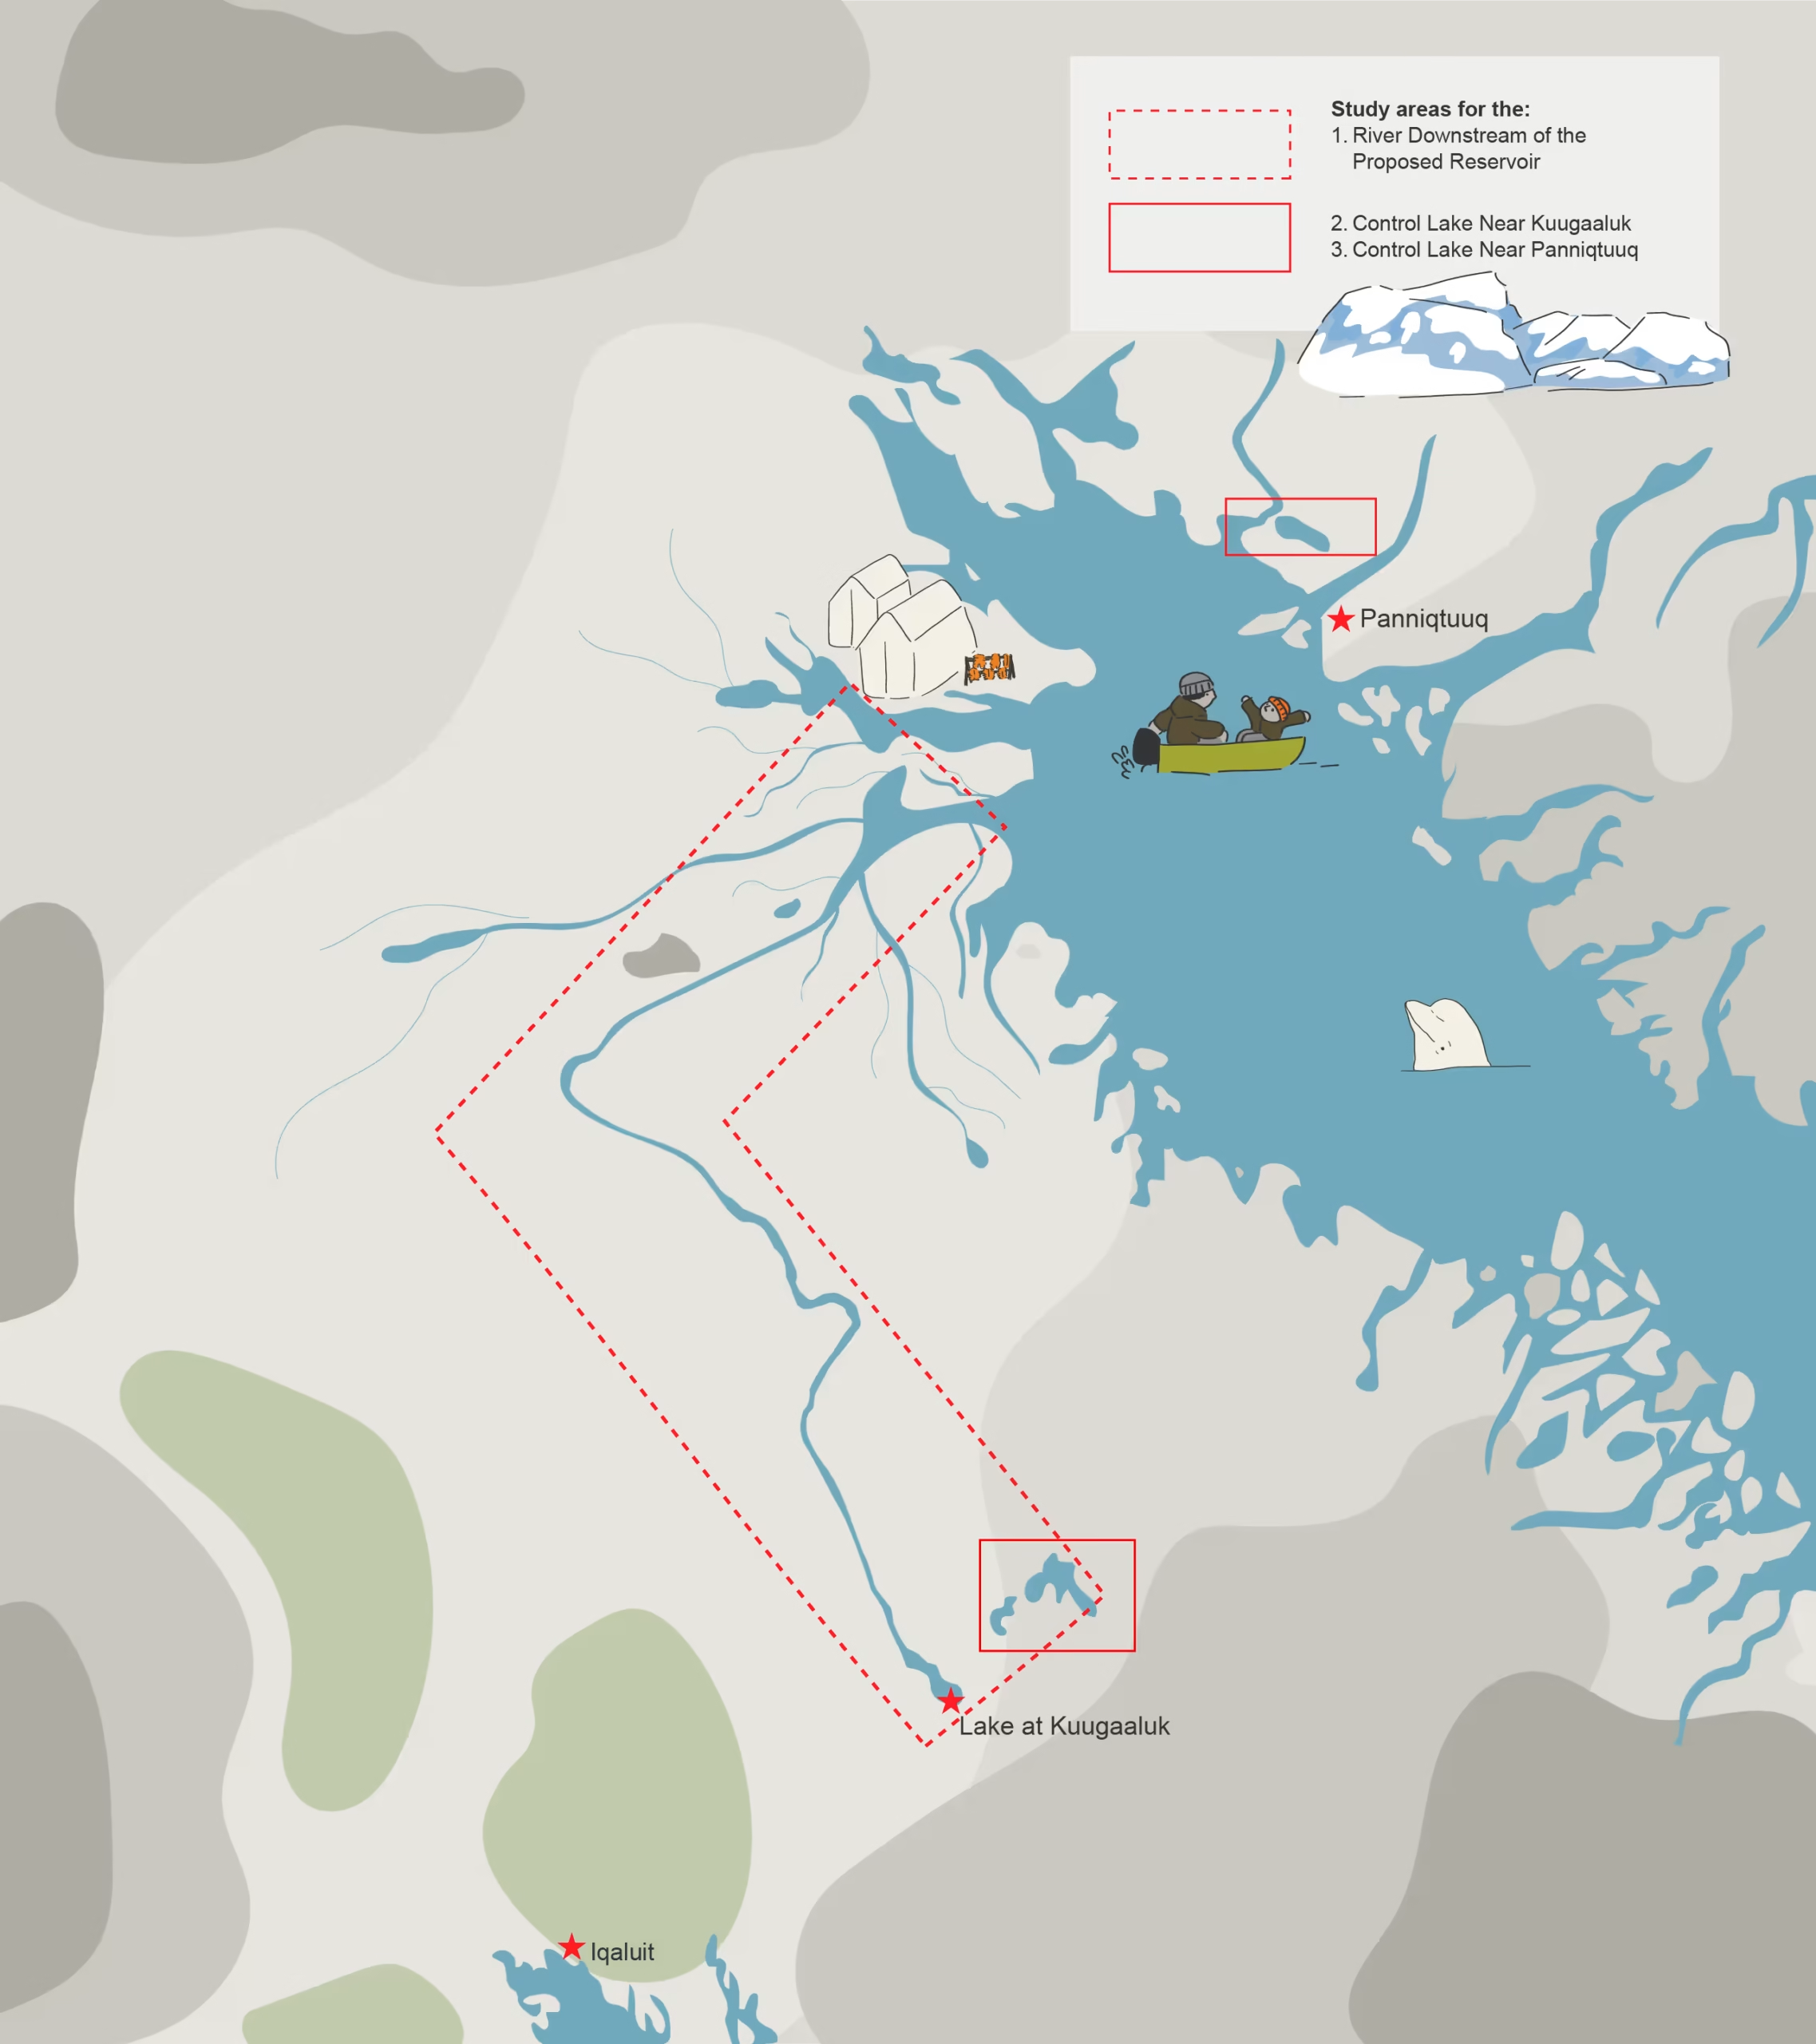
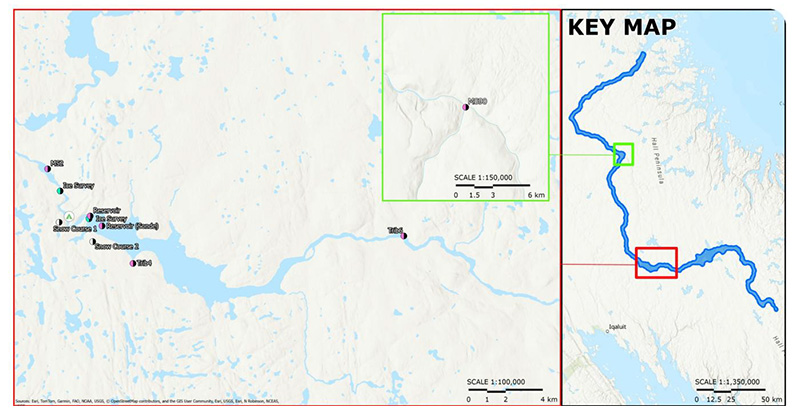
Study Area 1: The Downstream River
This study area is the river between the lake at Kuugaaluk and Irvine Inlet. This information helps us understand what the river downstream of the proposed project is like today. More studies will take place in 2027 to learn how the river could change if the water power project moves forward.
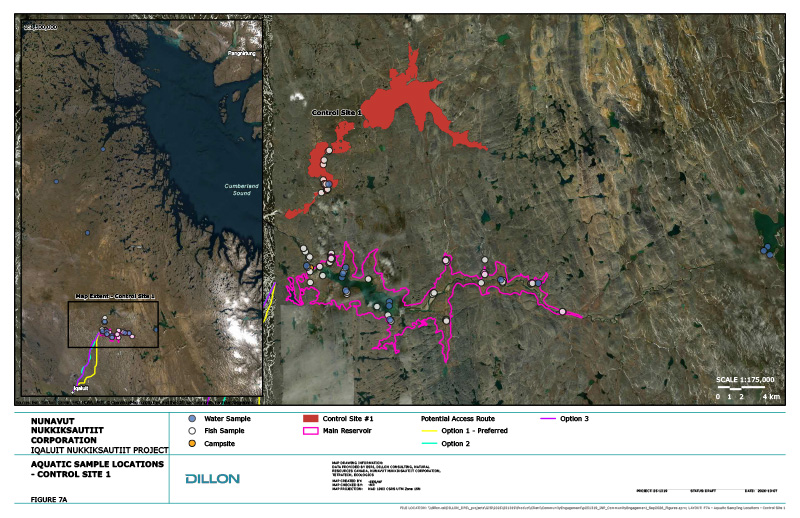
Control Lake #1: Near Kuugaaluk
This lake is part of a neighbour river system that's separate from the one being considered for the water power project. It's about 12km north of the lake at Kuugaaluk.
The aquatics team took fish samples and conducted water quality tests here, to compare them with those from the lake and river at Kuugaaluk. Thanks to Polar Outfitting for supporting this field work.
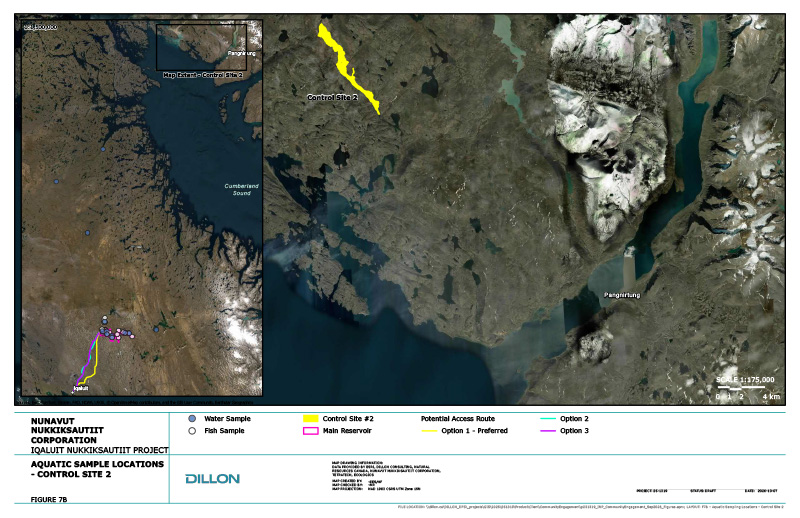
Control Lake #2: Near Panniqtuuq
This lake is near Panniqtuuq and is separate from the river system being considered for the water power project. It's about 240km away from Kuugaaluk (as the raven flies), and 35km northwest of Panniqtuuq.
The aquatics team took fish samples here to compare them to fish samples collected at Kuugaaluk.
Thank you to local Panniqtuumiut for collecting the fish and providing them to the aquatics team for testing.
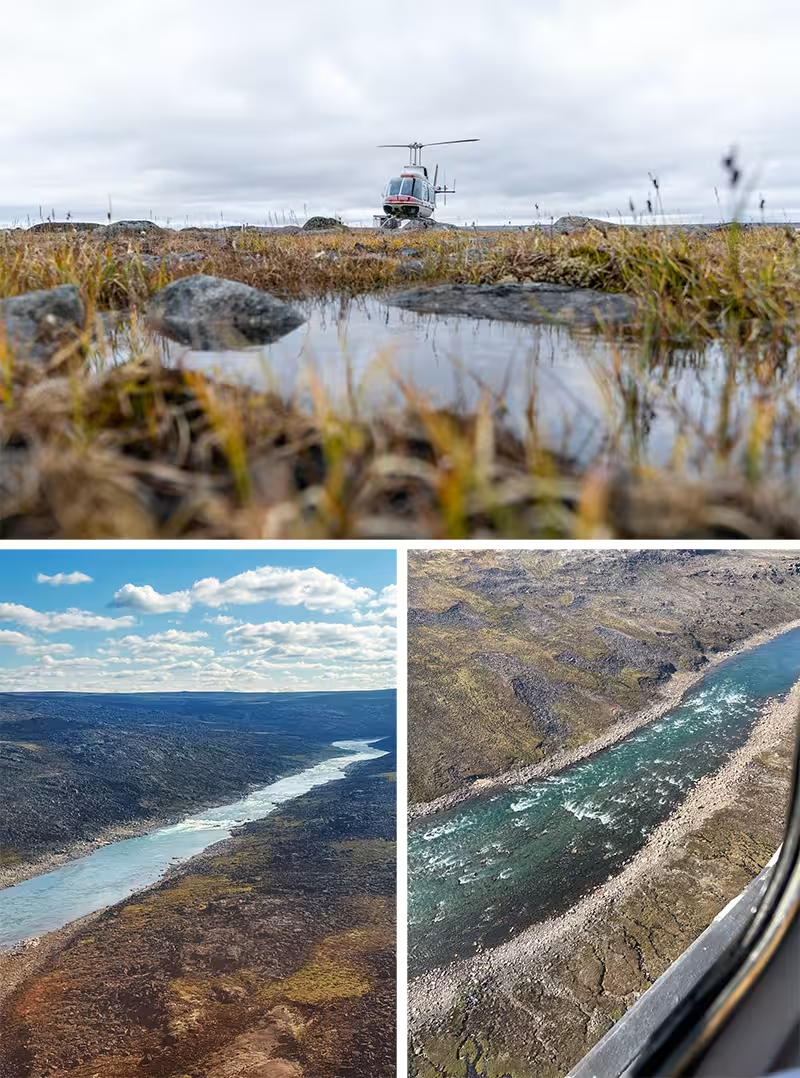
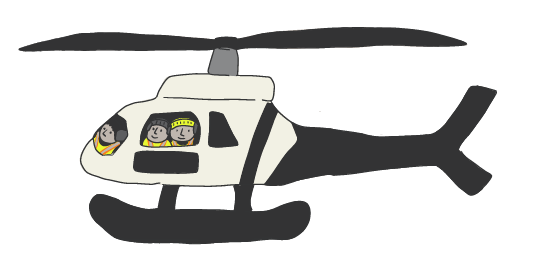
Travel by Helicopter
The aquatics team traveled by helicopter to reach study sites on the downstream river.
Water Level Loggers - Measuring the Amount of Water
The team installed a water level loggers about 90 km downstream of the lake. These tools measured and recorded the water level before, during, and after the spring melt, as it rises and falls.
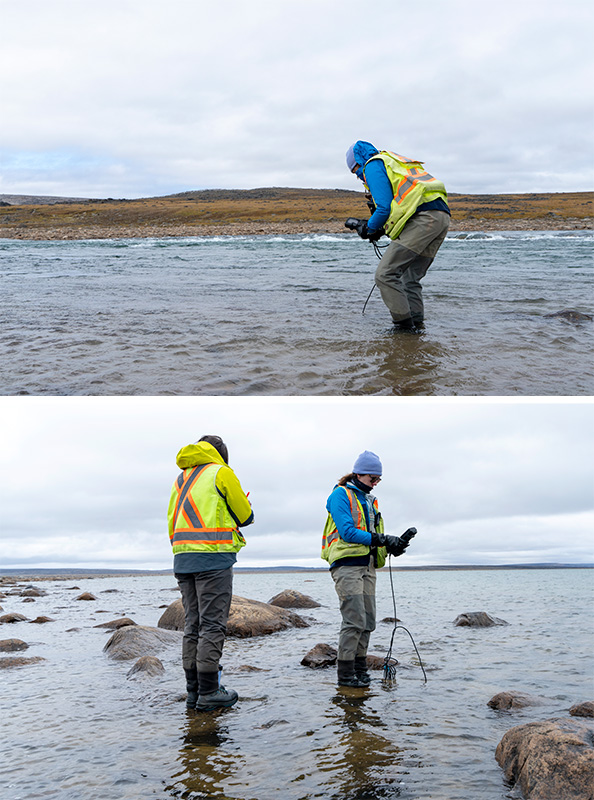
Water Data Loggers - Learning about Water Quality
The aquatics team put water quality loggers in the river about 90km downstream of the lake.
This tool measures the water's temperature, depth, how clear it was, and mineral and oxygen levels over time. It has satellite connection, meaning information constantly gets sent back to the team's office as it's collected.
Together with the water sample results, this helps us understand water quality today, and predict how the underwater environment could change if the project is built.
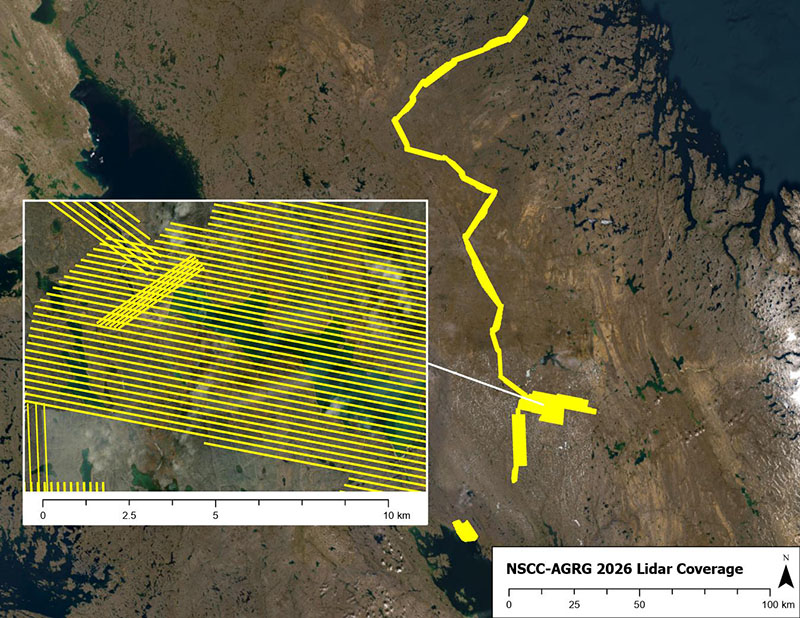
LiDAR Data Collection
LiDAR, which stands for Light Detection and Ranging, uses lasers to measure the shape of the land from above. This creates high-quality 3D maps of the ground.
LiDAR uses lasers from a drone to create detailed 3D maps of the land and water. LiDAR surveys were done all the way from the lake at Kuugaaluk to Irvine Inlet. This information helps the team understand fish habitat in smaller streams near the proposed reservoir.
Water Sampling - Learning about Water Quality
The aquatics team took samples of water from different depths in the downstream river, and the control lake near Kuugaaluk.
They sent these samples to laboratories to test for nutrients, metals, total organic carbon (this tells us about how much plant and animal life is in the water), and methylmercury levels.
Together with information from the water data loggers, this helps us understand water quality today, and predict how the underwater environment could change if the project is built.
Fish Sampling
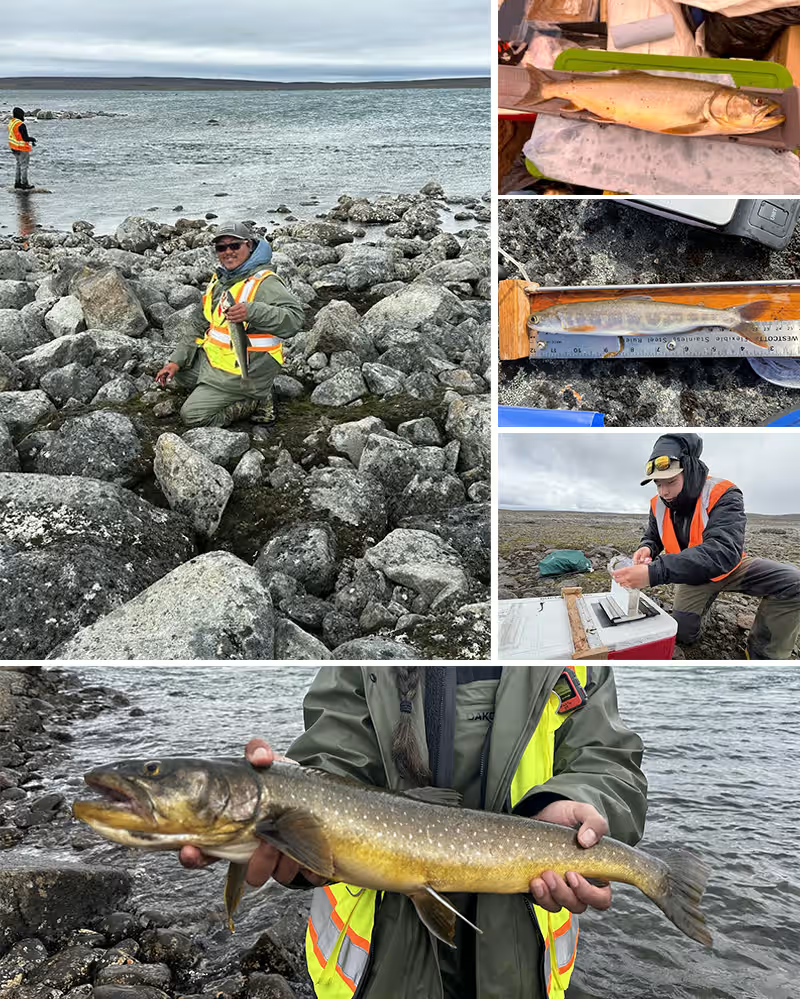
Local field crew members caught Arctic Char at Control Lake #1 about 12km north of Kuugaaluk using fishing rods and lures. They wrote down the type of fish, the length, weight, and life stage for each fish.
Fish Sampling
Local field crew members caught Arctic Char at Control Lake #2, about 35 km from Panniqtuuq using fishing rods and lures. They wrote down the type of fish, the length, weight, and life stage for each fish.
Some fish were immediately released. Other fish were respectfully killed by local crew, and samples were sent to the lab down south.
The samples tell us the fish's age, and how quickly it grew. They also let us learn about mercury levels, and other things that explain what the fish eat and where they live.
Results from the Control Lake are used as to compare against results from other areas fish were sampled from.
Research
Before going into the field, the aquatics team reviewed other water studies from the Chidliak Project (collected since 2020) as well as information from Fisheries and Oceans Canada about Arctic char in the area.
This information helped the team understand what is already known about the area. The new study results will be compared with this older information to build a picture of conditions today and help understand how the proposed project could change the area's water system.
The SurfBee - Measuring the Amount of Water
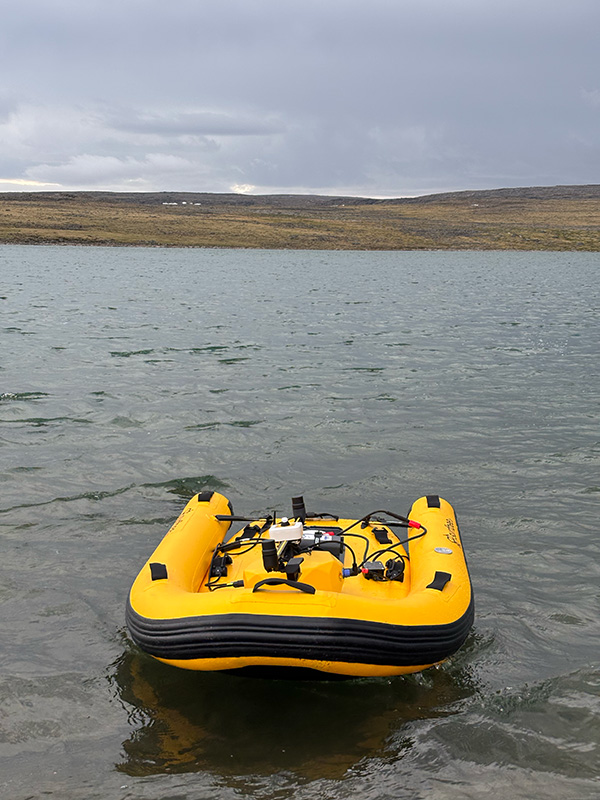
From the shore, the aquatics team sent a small remote-controlled boat (called a SurfBee) into the downstream river. The little boat has tools attached that measure how water moves through the river.
It travelled across wide shallow sections of the river, measuring:
- How deep the water was, and
- How fast the water was flowing
The team uses those numbers to figure out how much water moves through the river over time.
Underwater Sensors - Learning about Water Quality & Measuring the Amount of Water
The team installed sensors at a spot about 90km downstream of Kuugaaluk. These underwater sensors were dropped into the river on long cords to measure water depth, temperature and water quality over time.
Using Underwater Sensors, Water Data Loggers, and Water Sampling, these tools help us understand how lake water changes through the seasons.
Together with LiDAR Surveys, Underwater Sensors, and the SurfBee, these tools also help us figure out how much water moves through the river with the seasons. This is important for project planning, engineering, and future environmental studies.
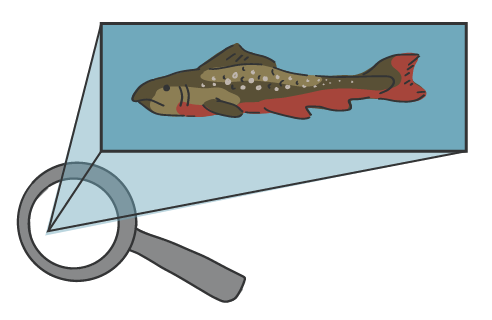
Char from Control Lake #1 (Kuugaaluk)
Lab testing of the fish caught in Control Lake #1 isn't finished yet.
However, lab testing of Arctic char caught near the proposed dam and reservoir have freshwater signatures, suggesting they live in freshwater and may not travel to the ocean.
More research is required to tell us where the fish travel, or if they travel.
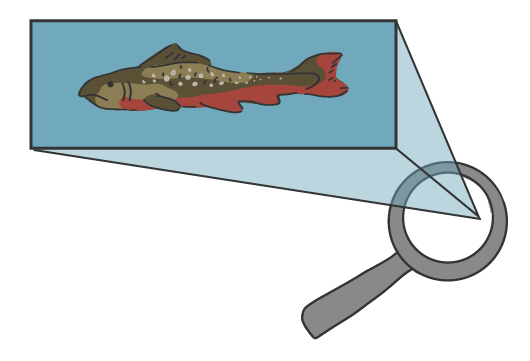
Char from Control Lake #2 (Pang)
The ten Arctic Char caught in Control Lake #2, near Panniqtuuq, showed chemical signatures of the marine environment, which means they might have had spent time in the ocean. More research is required to tell us where the fish travel, or if they travel.
Water Quality Results
Water quality was monitored from July 9 to 28, 2026. Water temperatures ranged from 8°C to 15°C, and there is a very low amount of salts and minerals in the water.
The water was generally very clear when river levels were low. But, it became much cloudier during periods of rainfall or snow and ice melt, when rising water levels carried more sediment into the river.
Further downstream, the team also observed changes in water conditions where rivers, streams, and currents meet.
Rainfall in mid-August caused water temperatures to drop from about 11°C to 8°C.

Water Levels
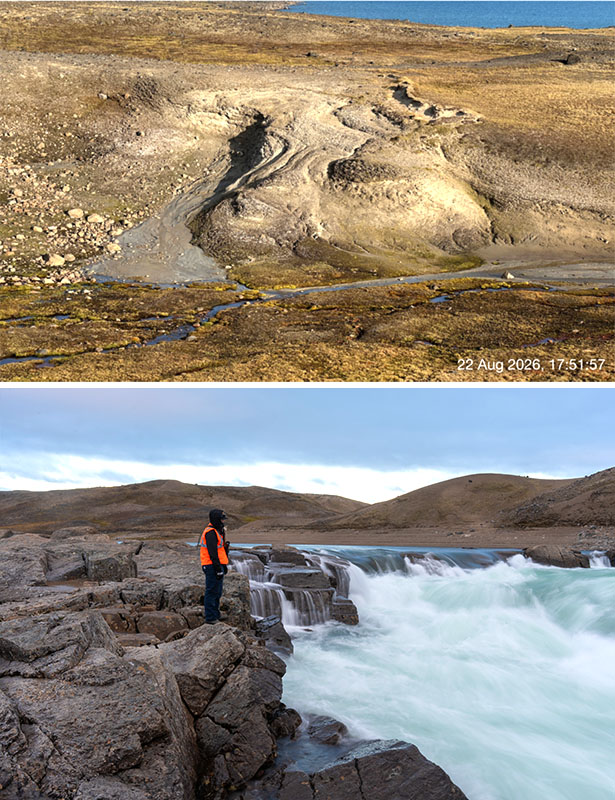
The downstream river is mainly fed by melting snow and ice. At a monitoring station about 90 km downstream of Kuugaaluk, water levels dropped by about 1.1m in mid-July 2026. Levels then rose again after summer rainfall.
Because this location is farther downstream and collects water from a much larger area, changes in rainfall can have a greater effect on river levels.
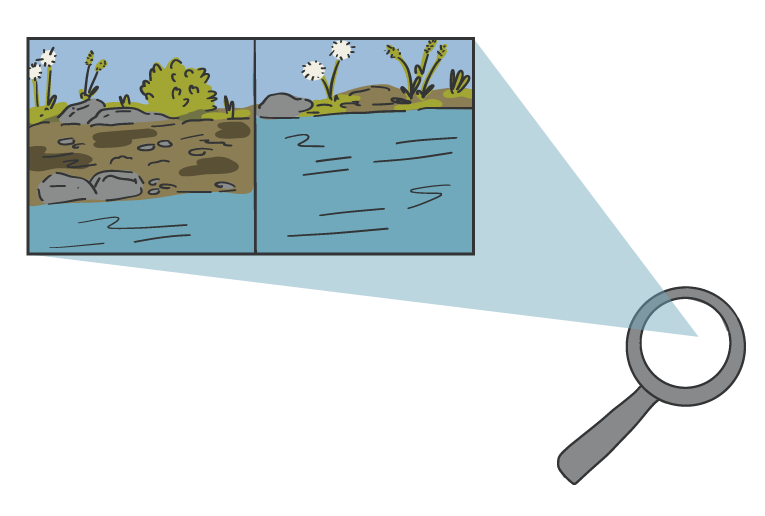
Wildlife & Terrestrial
The Wildlife and Terrestrial team completed surveys at Kuugaaluk between March 20 and August 29, 2026. EcoLogic Consultants Ltd. and Inuit technicians collected information about wildlife, plants and ecosystems in and around the proposed project area, including areas being considered for project infrastructure and access roads.
The information collected will help us better understand existing conditions on the land, plan future studies, and identify how the proposed project could affect wildlife, plants and their habitats so that potential effects can be avoided or reduced.
Thank you to our crew and local Inuit knowledge holders who made this work possible.
- Click on the people and equipment to learn what the team did during the field season.
- Click on the magnifying glasses and other objects to see what was found.
- Click outside the text boxes to hide them again.
Wildlife Cameras
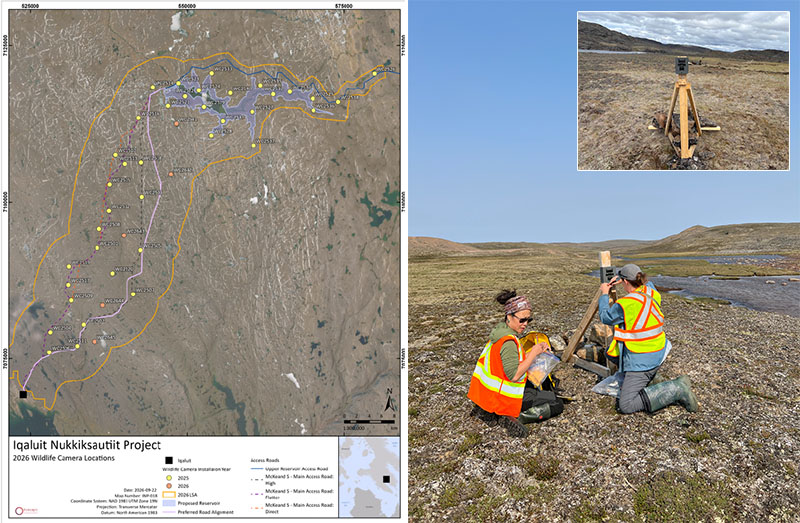
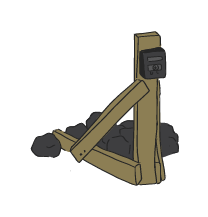
In 2025, 39 wildlife cameras were set up on the land to learn which animals use the area. These cameras have been taking photos for two summers now. In 2026, four new cameras were installed. Together, these 43 cameras take photos on a regular schedule, and also if anything moves nearby. There are:
- 19 around the proposed reservoir
- 24 along the proposed access road
The cameras capture real-time observations of wildlife. Data from the wildlife cameras will continue to be collected until September 2027. The team visits the camera network from time to time, to download all the photos for safe storage.
Looking On The Land – Animal Clues
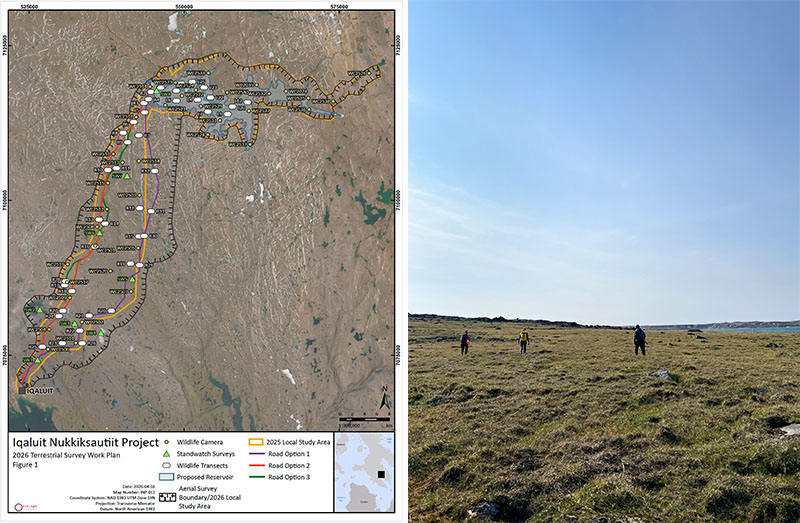
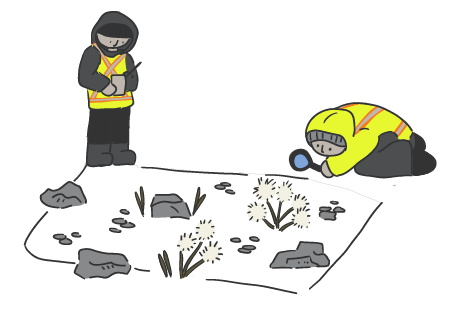
A ground wildlife transect is a 1 km line that researchers walk along, looking for signs of animals. They might see scat, tracks, fur, feathers, or other animal clues along the way. Everything they see gets written down.
A total of 43 ground wildlife transects were completed:
- 16 around the lake and upstream of the lake
- 27 along the proposed access routes
17 bird species and 5 mammal species were identified during the 2026 ground wildlife surveys, over 17 days.
Looking From the Land – Birds
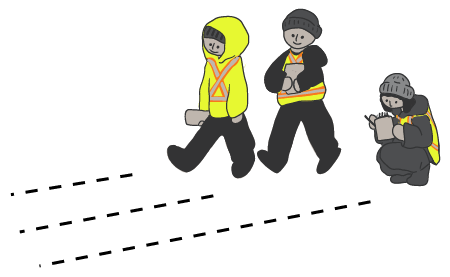
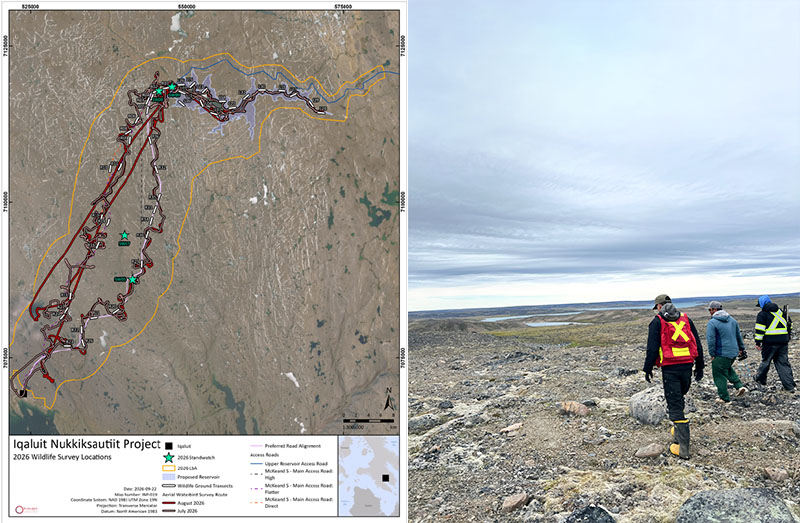
A stand-watch survey is a way to understand which birds are in an area, and how they move. Biologists stand in one place for two hours, and record all the kinds of birds they see, and what they were doing.
The crew completed stand-watch surveys at 4 different locations. Several bird species were spotted (such as waterbirds, gulls, and one falcon), or their calls were heard (such as American pipet and Lapland Longspur).
Looking On the Land - Rare Plants
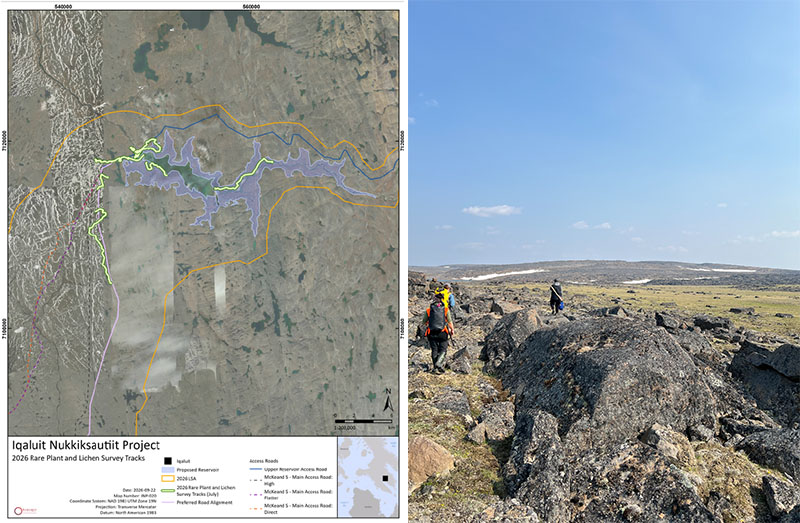
A rare plant transect is a 2 - 6km line that researchers walk along, looking for rare plants and lichens.
In 2026, the team did rare plant transects near the proposed reservoir and northern sections of the proposed access roads. They walked the land, writing down the kinds of plants they saw and picking small samples of mosses and lichens when needed, to help them figure out which types they were.
The team did 9 rare plant transects during one week of study.
Air Calls – Contributing to ELC mapping
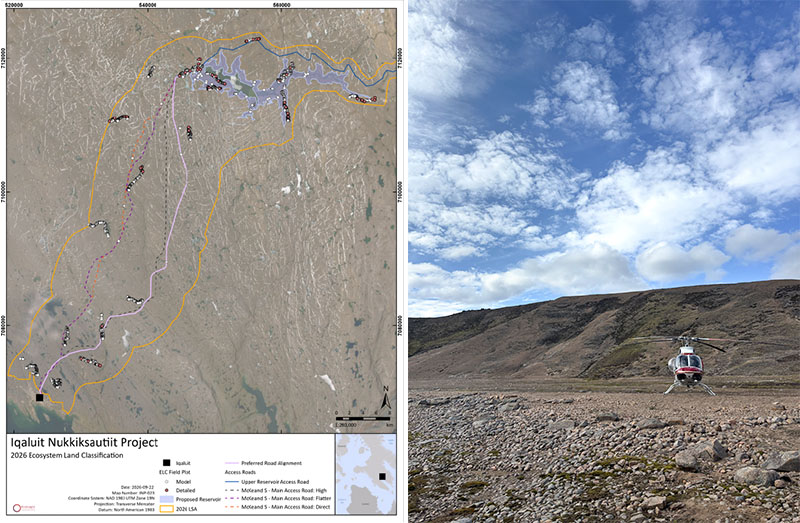
Researchers do air calls by flying over the land in a helicopter and taking photos to help describe the landscape and communities of plants.
Most of the Ecosystem Land Classification mapping was done from the ground, but these air calls improved and confirmed that work.
Click on Map Making and Ecosystem Land Classification to learn more.
Looking From Above – Waterbirds and Wildlife
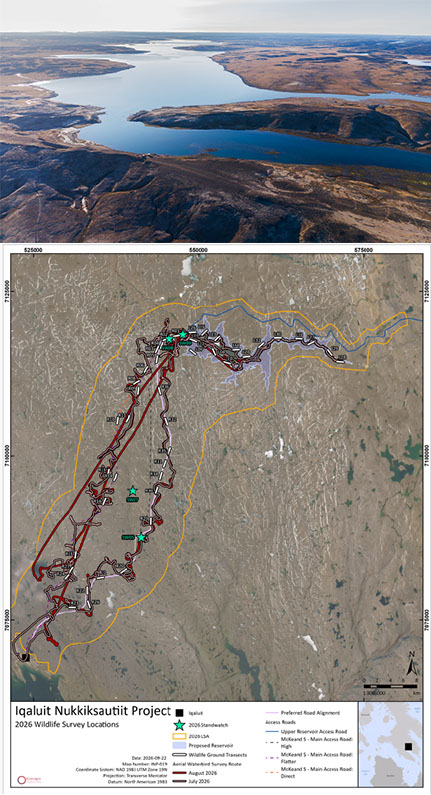
Biologists did two helicopter surveys to look for waterbirds and other animals. They wrote down how many of each kind were found, and where. Several types of waterbirds were seen including geese, loons, ducks, and gulls. Snow buntings were also commonly seen.
Ground Plots - Contributing to ELC Mapping
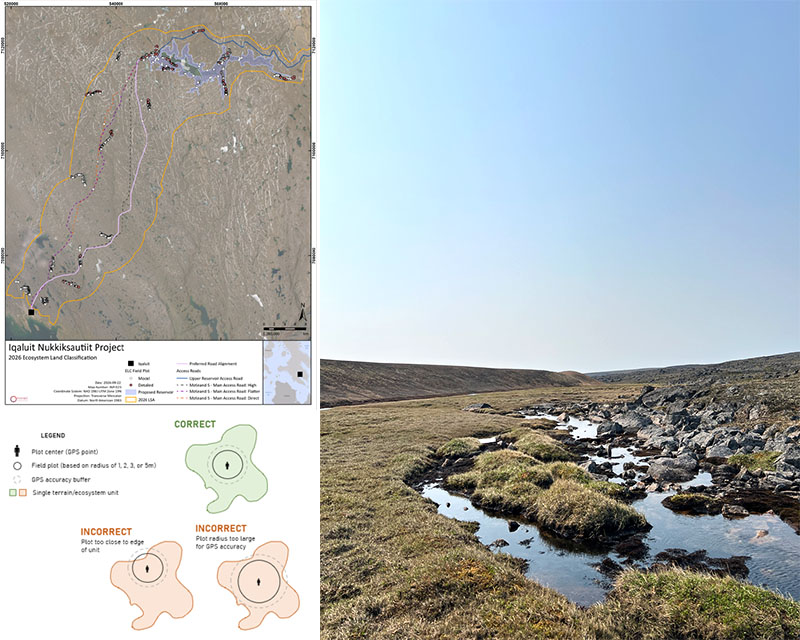
A ground plot is a square area, 10m by 10m, that researchers use to understand how common different plants are in different places. The field crew studied over 2,400 ground plots by walking the land.
Together with the air calls, ground plots help create the Ecosystem Land Classification (ELC) map of the study area. This map shows the different types of ecosystems found across the study area.
In 2025, the researchers made their first summary of the ecosystems and landscape. In 2026, they collected more detailed information to make the ecosystem land classification even better. They dug small holes in the ground, listed the different types of plants, and wrote down descriptions of each area. Knowledge from local Inuit helped the team understand how different areas of the land are similar or different.
Click on Map Making and Ecosystem Land Classification to learn more.
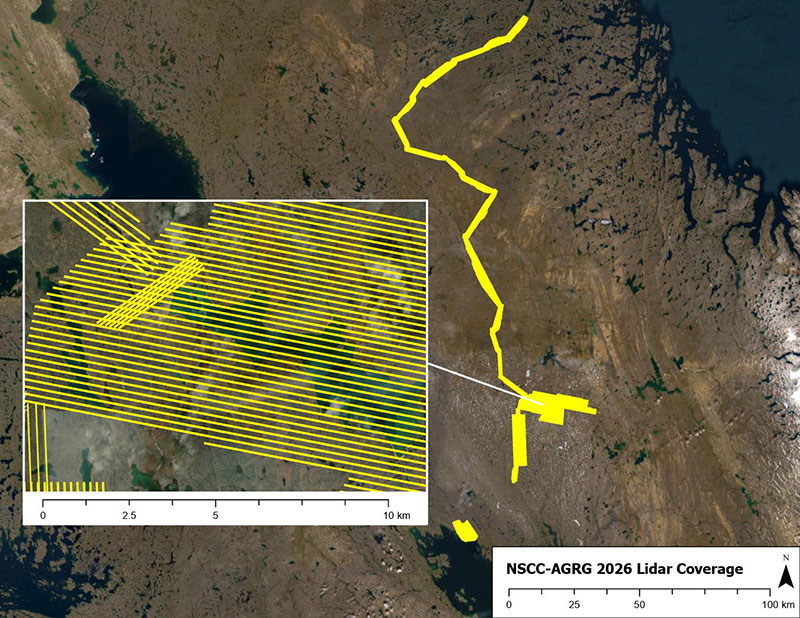
LiDAR – Contributing to ELC Mapping
A very detailed map of the entire project area was completed using LiDAR.
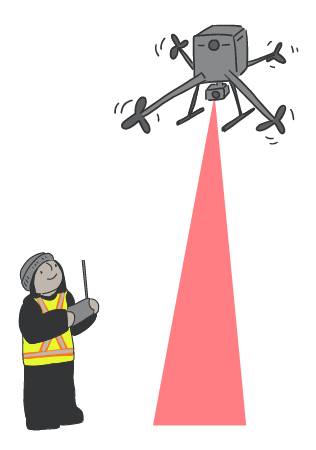
LiDAR, which stands for Light Detection and Ranging, uses lasers to measure the shape of the land, from above. This creates high-quality 3D maps of the ground.
The LiDAR map and images help make the ELC map as correct as possible.
Click on Map Making and Ecosystem Land Classification to learn more.
Map Making - Ecosystem Land Classification
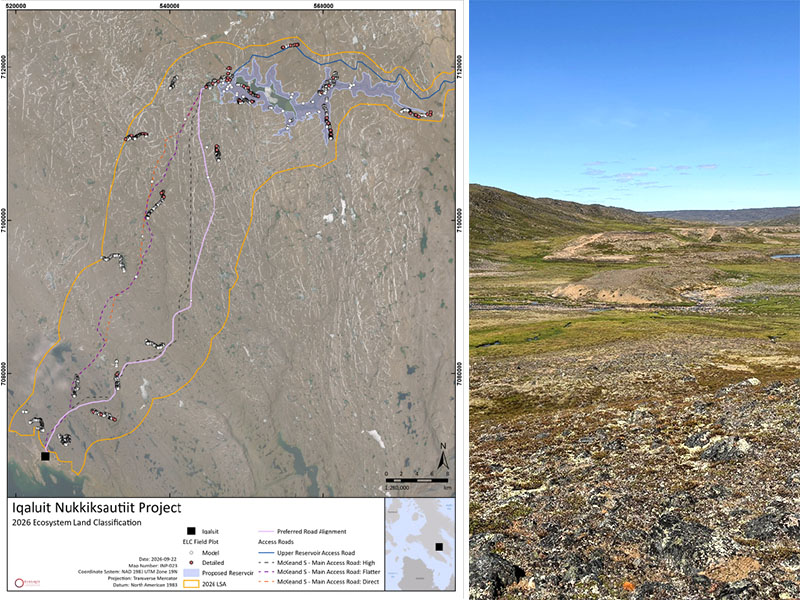
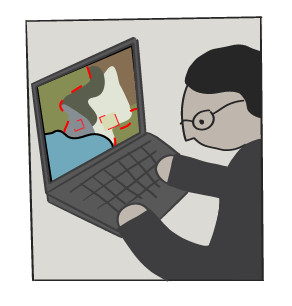
Scientists made an Ecosystem Land Classification (ELC) map using data from:
- 2025 and 2026 ground plots (observations from walking the land)
- 2025 and 2026 air calls (observations from helicopter)
- High-resolution LiDAR (2025 and 2026 surveys)
- Infrared images available on the internet
- Other satellite imagery
More than 2,400 field inspections (ground plots and air call plots) were used to create the ELC map.
Click on Ecosystem Land Classification to learn more.
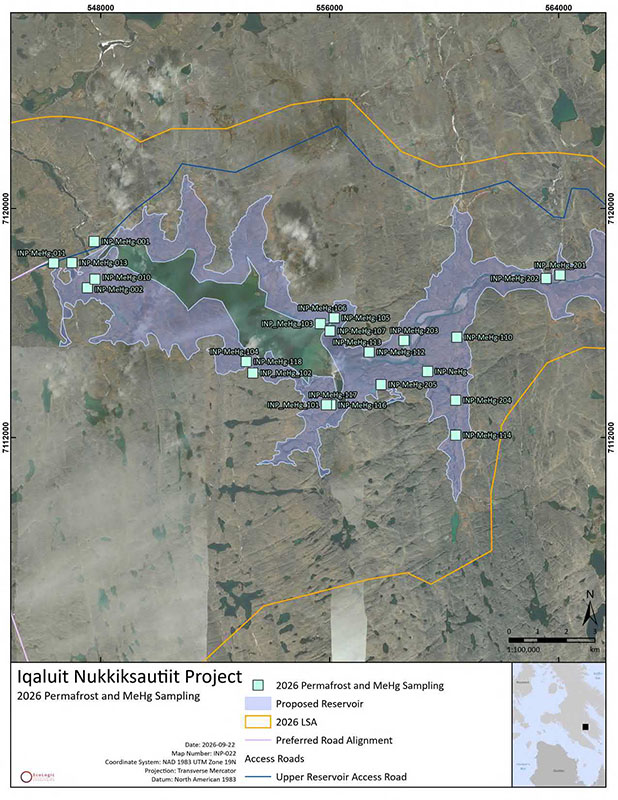
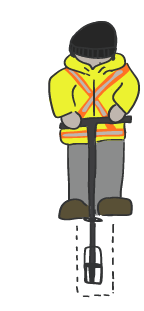
Studying Current Mercury Levels
Researchers collected 26 samples of soil (including dead plant and animal materials) in late August from the proposed reservoir area, to test for mercury levels.
Mercury is naturally found at low levels in soil, rock, water, and dead plants that are breaking down. When land is flooded, some mercury can change into methylmercury. This different form of mercury can build up in fish and other animals through the food chain.
Testing the soil lets scientists learn what the mercury levels in the proposed reservoir area are right now. Then, they can figure out the potential for methylmercury to increase if the land is flooded. This information helps the team, and the public, understand possible effects on fish, wildlife, and country food.
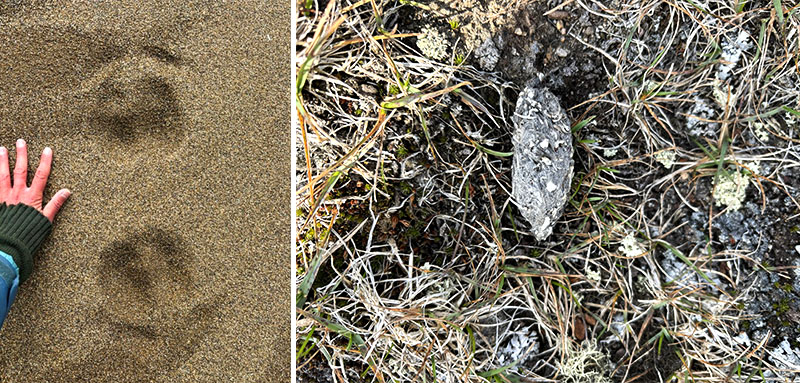
Animal Clues
Biologists, Inuit wildlife monitors, and surveyors saw signs of animals such as scat, tracks, fur, and feathers throughout the study areas. These help us figure out which animals are using the area, even if we can't see them. They also help us understand their movements and behaviour, and where they go and don't go.
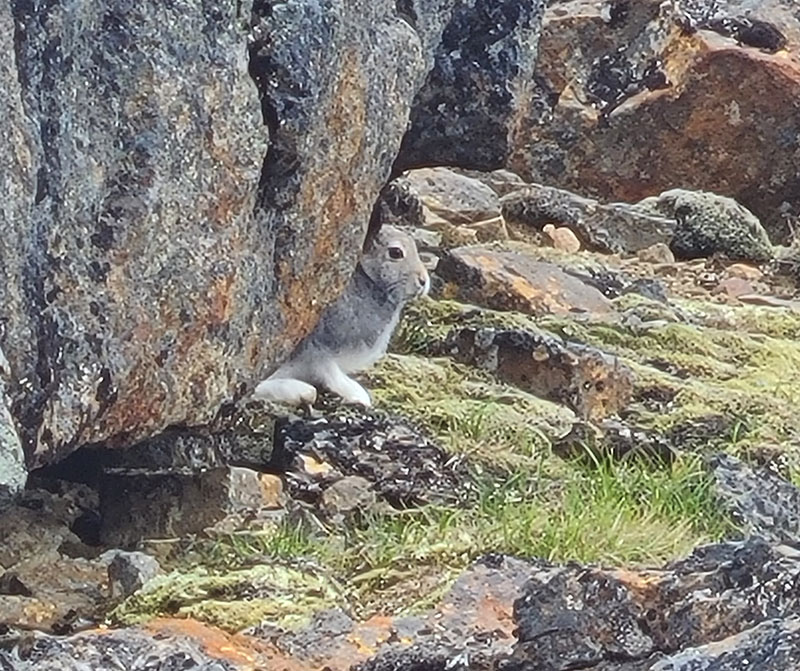
Arctic Hare
Arctic hare were seen in the study areas during the wildlife ground transects.
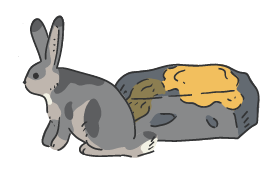
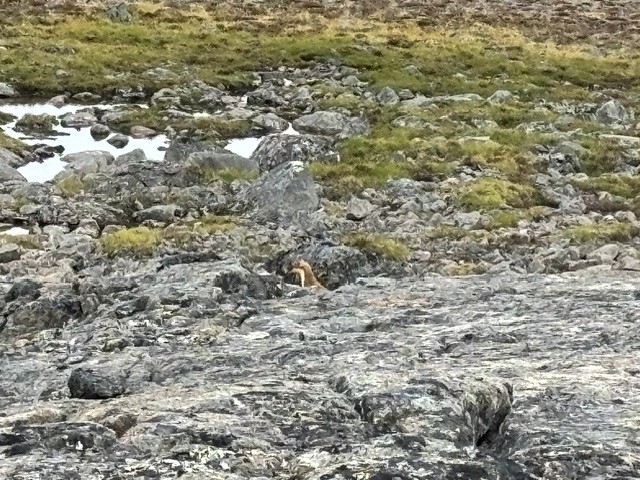
Short-tailed Weasel
Short-tailed Weasels were seen in the study areas during the wildlife ground transects.
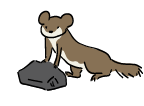
Lemmings
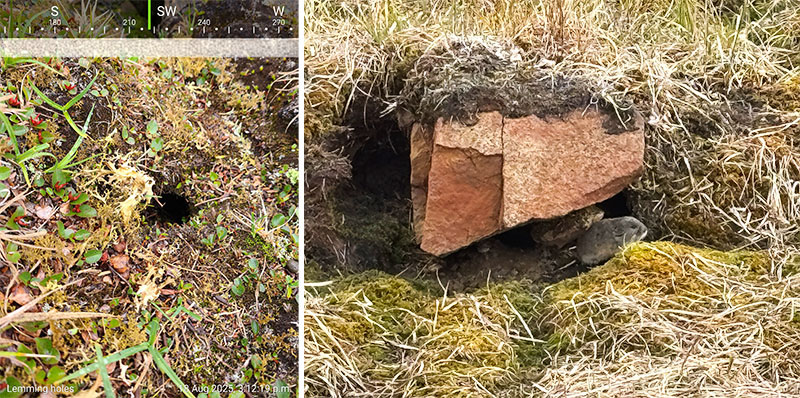
Lemmings were seen in the study areas during the wildlife ground transects. Although they are small, lemmings are an important food source for many other animals, including foxes and birds.
Arctic Fox
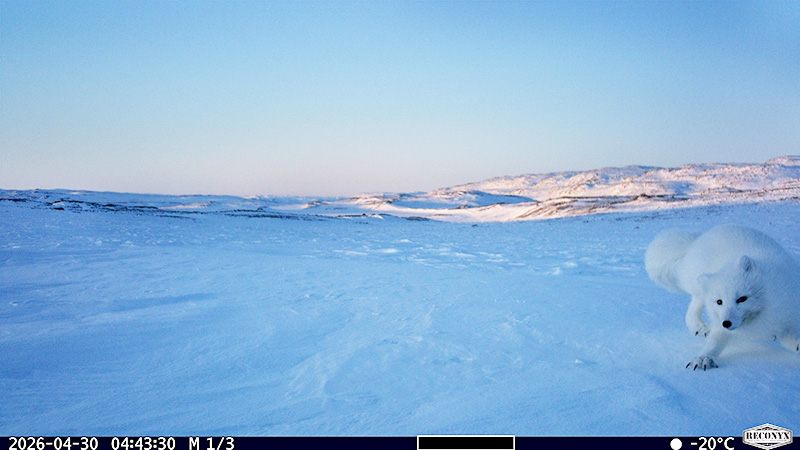
One Arctic fox was seen on a wildlife camera along the proposed access road area. Hair and scat from Arctic fox were also found during many of the ground transects.
Arctic Songbirds
American Pipit, Lapland Longspur, and Snow Bunting were all observed at various locations of the study areas during standwatch surveys and ground transects. These observations help the project team understand where songbirds live, breed, and use the area during the summer.
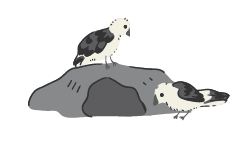
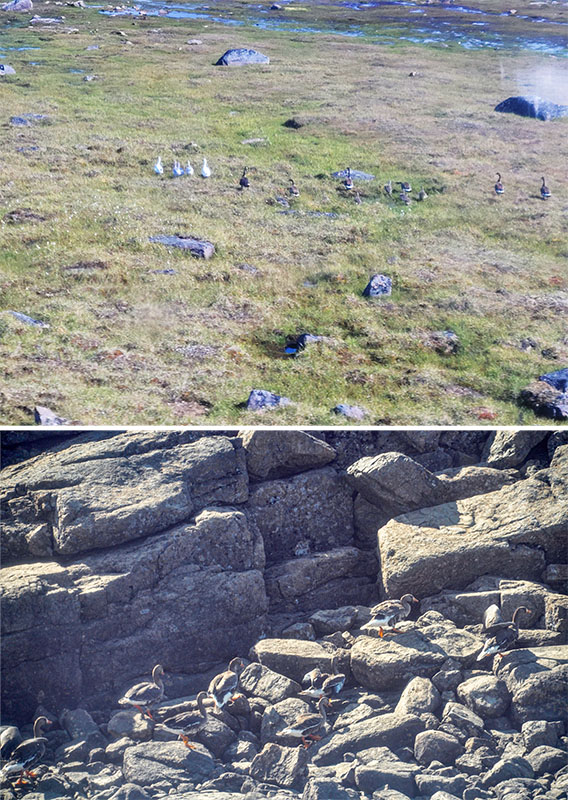
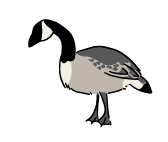
Geese
Canada Geese, snow geese, and greater white-fronted geese were seen throughout the study area during stand-watch surveys, helicopter surveys and ground transects. The team learned about how and where geese feed, rest, and migrate.
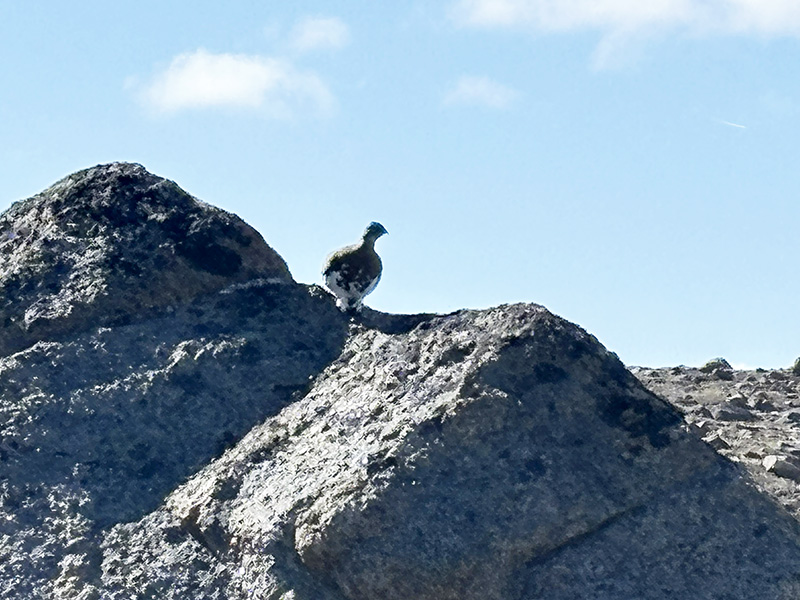
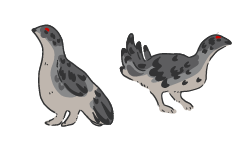
Ptarmigan
Rock Ptarmigan were observed during ground transects.
Gulls
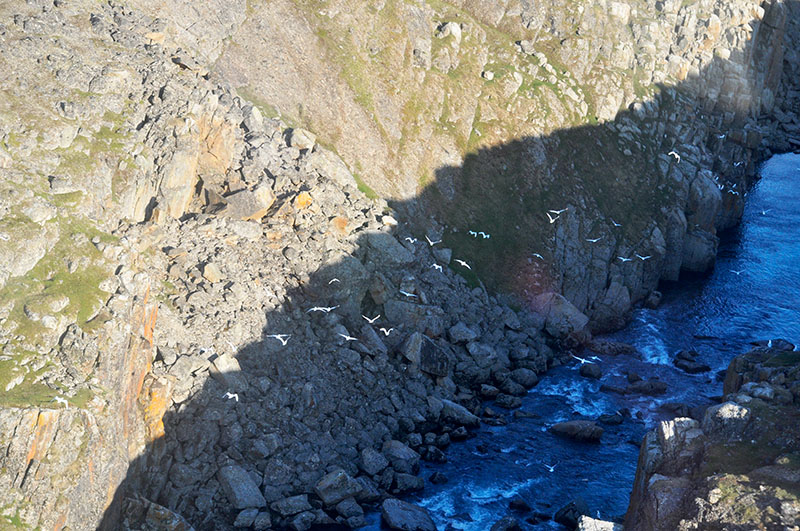
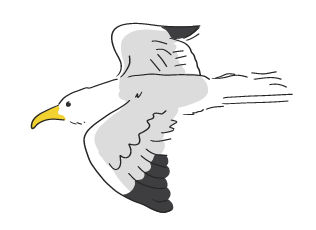
American Herring Gulls and Glaucous Gulls were observed at various locations during the 2026 study season.
An active Glaucous Gull nest colony was found on a cliffside near the proposed access road.
Birds of Prey
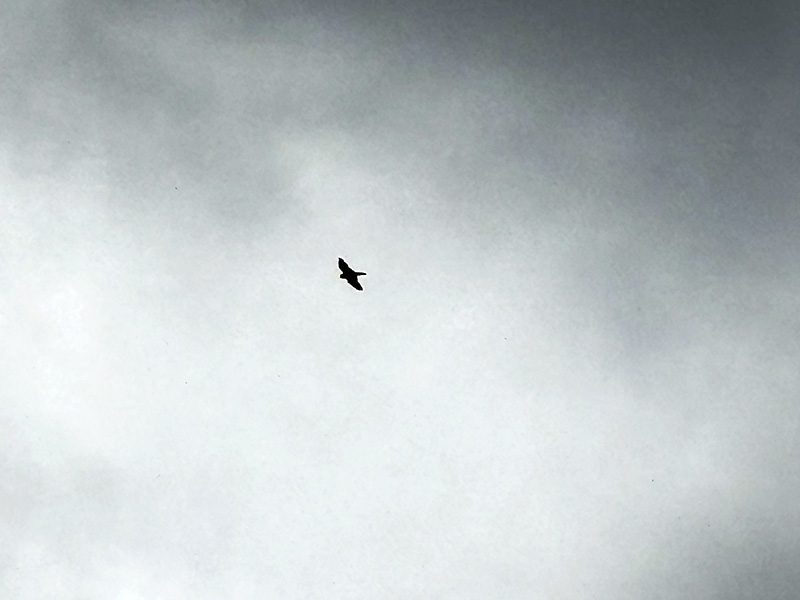
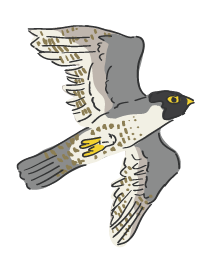
One peregrine falcon was observed flying along the shoreline of the lake during stand-watch surveys. Rough legged hawks were observed during the helicopter waterbird surveys.
Caribou
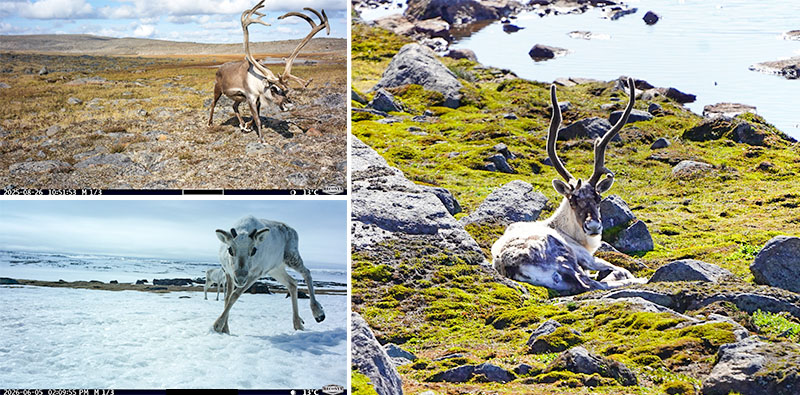
Barren-ground caribou continue to be seen by wildlife cameras. Biologists and Inuit wildlife monitors also found signs of caribou, including scat, tracks and shed antlers, during ground transects.
They were most commonly seen along the south shore of the lake and upstream of the lake. The wildlife camera network will keep taking photos of any animals through the fall and winter. Studies will continue in 2027.
Caribou protection is a very high priority. Learnings about caribou will guide the location and design of project infrastructure, in order to minimize any potential impacts. They will also provide a baseline to compare to, for future monitoring.
Caribou Calves
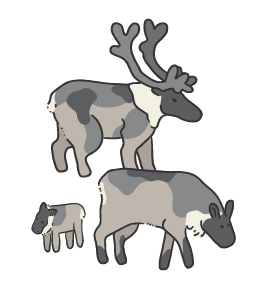
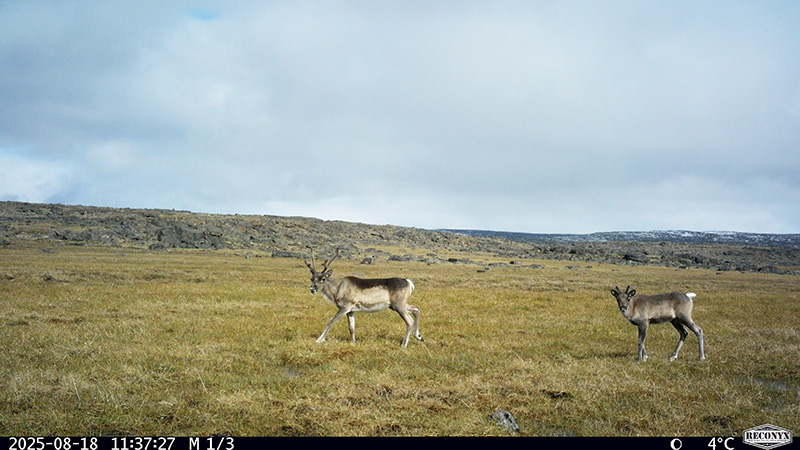
Five caribou calves were seen during ground transect surveys. Biologists noted that the area upstream of the proposed reservoir could be important habitat for calf-rearing.
The wildlife camera network will keep taking photos of any animals through the fall and winter. Studies will continue in 2027.
Common Plants
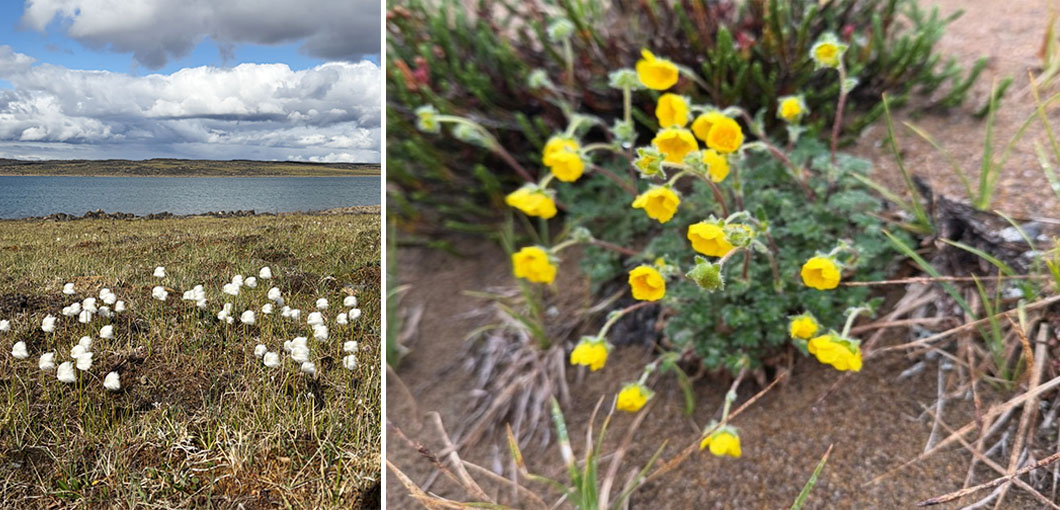
So far, 82 different plants have been identified in the study areas. Biologists noted a high plant diversity, including some types that are uncommon in the local area, along the river downstream of the lake. Mosses and lichens are still being identified in the lab.
Inuit wildlife monitors and technicians shared information about traditional use of plant species and how Inuit use the land. Alpine sorrel is an important edible plant for Inuit when out on the land.
Understanding which plant communities and habitats are around Kuugaaluk, and which ones are especially important to Inuit guide project design and environmental planning.
Rare Plants
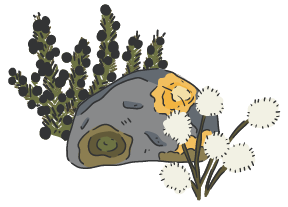
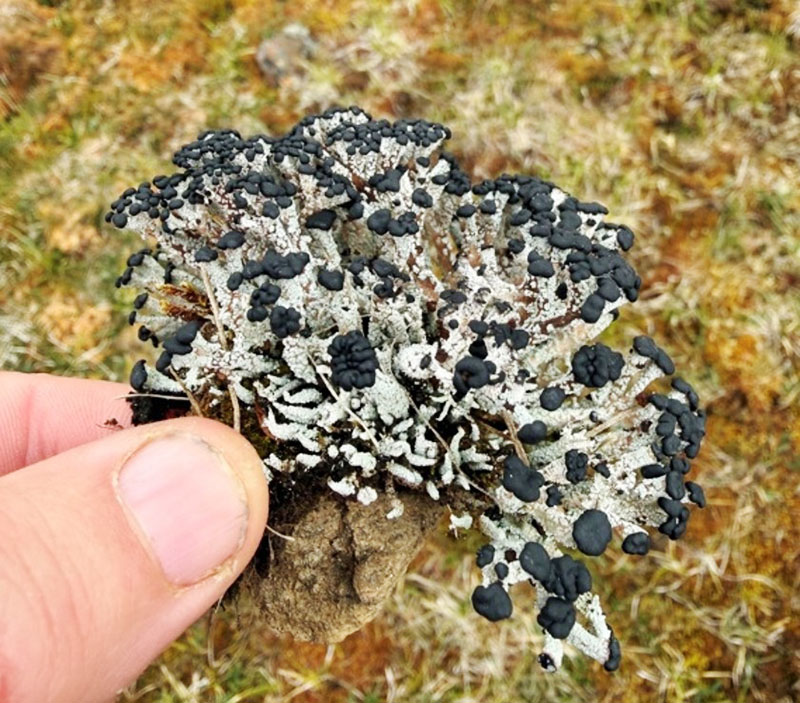
Biologists found Robust Matchstick Lichen and Spitsbergen Earwort in the study areas - both uncommon. This was the first time Robust Matchstick Lichen had been recorded in Nunavut, in western science. This helps the team to avoid or reduce impacts on sensitive habitats.
Ecosystem Land Classification
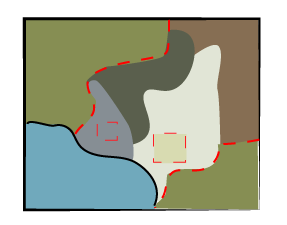
The research team developed an Ecosystem Land Classification (ELC) map field observations and computer modeling.
An ELC map divides the study area into smaller pieces, and groups them into different ecosystem types, based on:
- Plants
- Animals
- Soil and ground conditions
- Landforms like hills or valleys
- Water (streams, ponds, wetlands, or dry areas)
- Micro-climates
By studying these features, we can see where different types of nature are found and how common those types are. This helps us protect the land and understand how the project might affect the environment.
Inuit wildlife monitors and technicians shared valuable knowledge about how wildlife and Inuit use different ecosystems throughout the year. The data collected this year continues to refine this process.
Types of Nature - Ecosystem Land Classification
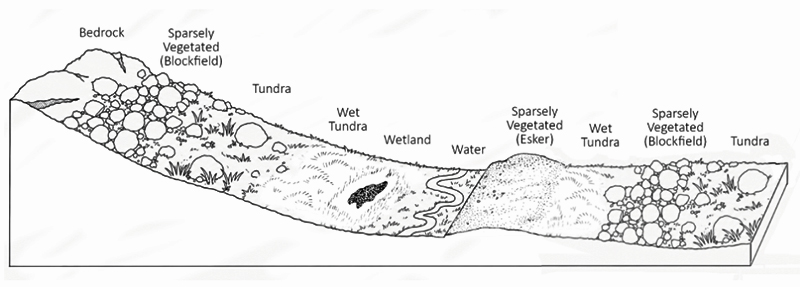
The visual ground plots and air calls helped confirm the 10 ecosystem types proposed in 2025, and also helped us find 5 new ones in the study area. Some of the ecosystems observed were:
- Ponds & Lakes
- Creeks and Rivers
- Brown Moss Wetland
- Cottongrass Wetland
- Wet Tundra
- Mesic Tundra
- Lichen Tundra
- Exposed Soil
- Fellfield
- Blockfield
- Bedrock
Click on Map Making and Ecosystem Land Classification to learn more.
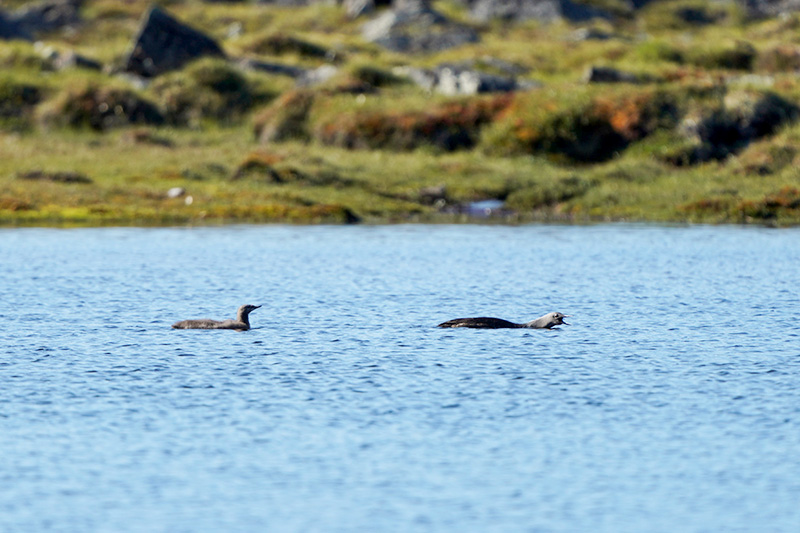
Waterbirds
Several types of waterbirds were identified during the stand-watch surveys and helicopter surveys. These include the Canada goose, red-throated loon, common loon, and long-tailed duck.
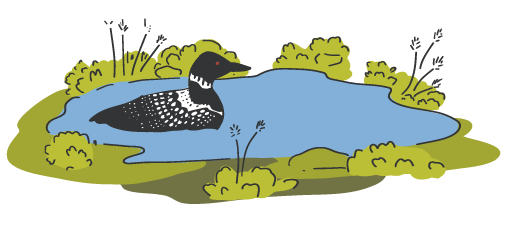
Methylmercury Testing
Samples are being tested in the lab to look for mercury. The samples give a "before picture" of the land that could be flooded. They will show us if the ingredients are there to make methylmercury, if the ground was covered in water. We're still waiting for the results, but as soon as we have them, they be checked alongside water, sediment, fish, and permafrost studies. Then we'll know if more testing or monitoring is needed. Results will also be shared with the public as soon as they're available.
Camp Life
This temporary camp was home base for all teams working at Kuugaaluk throughout the 2026 field season. 24 tents were set up for sleeping, eating, and working. An NNC Site Manager, a Health and Safety Monitor, two helicopter pilots, and a helicopter mechanic also stayed at the camp at all times. At its busiest, there were 48 people staying at camp.